# ========================================================================
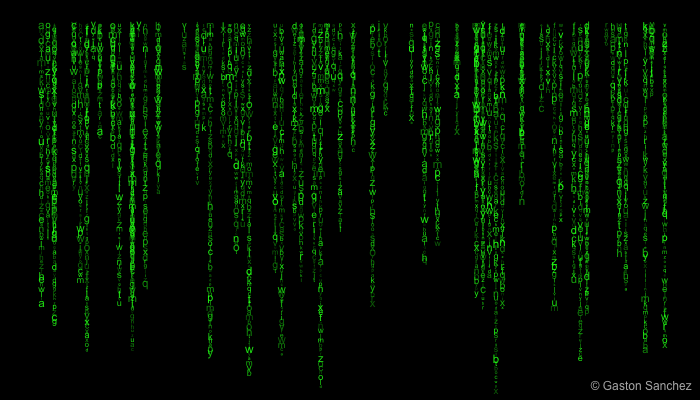
# Matrix
# ========================================================================
# generate pairs of x-y values
nx <- 100
ny <- 80
x <- sample(x = 1:nx, size = 90, replace = TRUE)
y <- seq(-1, -ny, length = 90)
png("matrix.png", width = 700, height = 400)
# set graphical parameters
op <- par(bg = "black", mar = c(0, 0.2, 0, 0.2))
# plot
plot(1:nx, seq(-1, -nx), type = "n", xlim = c(1, nx), ylim = c(-ny+10, 1))
for (i in seq_along(x))
{
aux <- sample(1:ny, 1)
points(rep(x[i], aux), y[1:aux], pch = sample(letters, aux, replace = TRUE),
col = hsv(0.35, 1, 1, runif(aux, 0.3)), cex = runif(aux, 0.3))
}
# signature
legend("bottomright", legend = "© Gaston Sanchez", bty = "n",
text.col = "gray70")
# reset par
par(op)
dev.off()