# ========================================================================
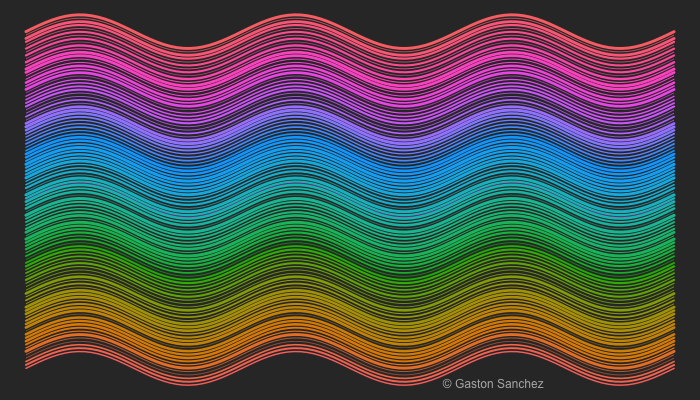
# Rainbow Waves
# ========================================================================
# generate pairs of x-y values
n <- 100
x <- seq(0, 6*pi, length = n)
y <- sin(x)
# function to generate colors like ggplot2
gg_color_hue <- function(n) {
hues <- seq(15, 375, length = n + 1)
hcl(h = hues, l = 65, c = 100)[1:n]
}
# vector of colors
cols <- gg_color_hue(n)
png("rainbow_waves.png", width = 700, height = 400)
# set graphical parameters
op <- par(bg = "gray20", mar = rep(0, 4))
# plot
plot(x, y, type = "n", ylim = c(-11, 11), axes = FALSE)
lines(x, y, col = hsv(0.85, 1, 1, 0.7))
aux <- 1
for (i in seq(-10, 10, length = n))
{
lines(x, y + i, col = cols[aux],
lwd = 2*runif(1, 0.3, 2))
aux <- aux + 1
}
# signature
legend(x = 11.5, -10, legend = "© Gaston Sanchez", bty = "n",
text.col = "gray70")
# reset par
par(op)
dev.off()