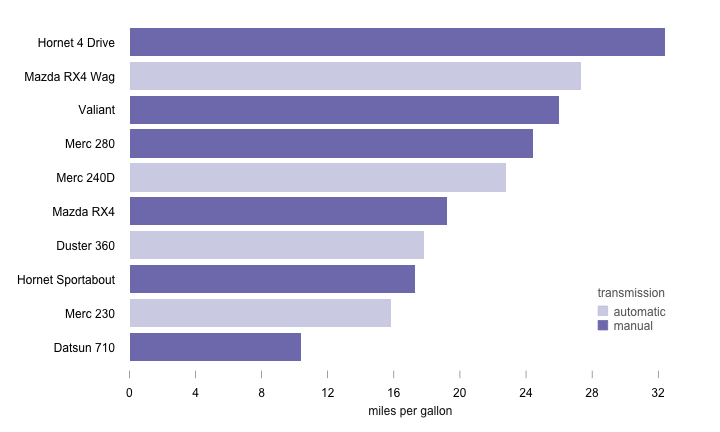
# ======================================================== # Data # ======================================================== # load data 'mtcars' data(mtcars)# setting seed for random numbers set.seed(898)# random sample to select 10 cars rand_sample=sample(1:nrow(mtcars),size=10)index=sort(mtcars[rand_sample,1])ord_index=order(mtcars[rand_sample,1])# colors for transmission (automatic, manual) automatic=mtcars[rand_sample,"am"]cols=rep("#BCBDDCAA",length(rand_sample))cols[automatic==0]="#807DBA"# ======================================================== # Plot # ======================================================== # set graphic margins op=par(mar=c(4,9,1,2))# barplot barplot(index,col=cols,border=NA,horiz=TRUE,xlim=c(0,34),names.arg=rownames(mtcars)[ord_index],axes=FALSE,cex.names=1,las=2)# add x axis axis(side=1,at=seq(0,34,4),line=-0.25,lwd=0,lwd.ticks=0.5,cex.axis=1)mtext("miles per gallon",side=1,line=2,col="gray10")# add legend legend(28,3,legend=c("automatic","manual"),pch=22,bty="n",title="transmission",pt.cex=2,text.col="gray40",pt.bg=c("#BCBDDCAA","#807DBA"),col=c("#BCBDDCAA","#807DBA"))# turn off par par(op)