# ========================================================
# Data
# ========================================================
# setting seed for random numbers
set.seed(999)
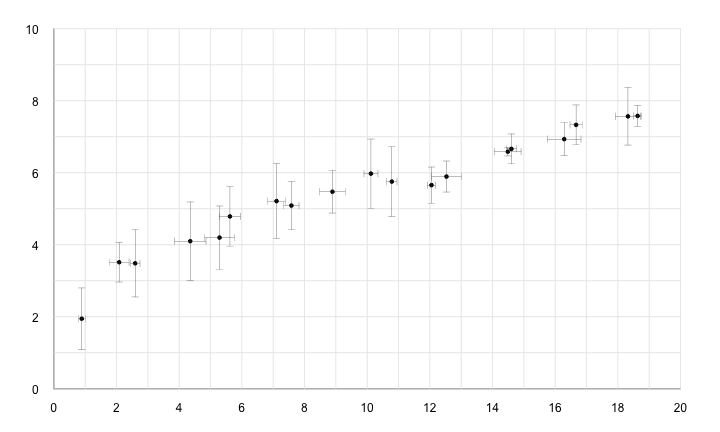
# generate x and y
x = 0:18 + runif(19) + 0.5
y = 8 * sqrt(x/30) + runif(19) + 0.5
# generate errors
x_err = runif(19) * 0.5 + 0.1
y_err = runif(19) + 0.1
# ========================================================
# Plot
# ========================================================
# set graphic margins
op = par(mar = c(2, 2, 1, 1))
# call plot
plot.new()
# define plot window
plot.window(xlim = c(0, 20), ylim = c(0, 10))
# add axis
axis(side = 1, pos = 0, lwd.ticks = 0, labels = FALSE)
axis(side = 2, pos = 0, lwd.ticks = 0, labels = FALSE)
# add tick labels
mtext(seq(from=0, to=20, by=2), side = 1, line = -0.2,
at = seq(from=0, to=20, by=2))
mtext(seq(from=0, to=10, by=2), side = 2, line = -0.7,
at = seq(from=0, to=10, by=2), las = 2)
# add grid lines (don't use abline because it misbehaves)
segments(rep(0, 10), seq(from=0, to=10), rep(20, 10),
seq(from=0, to=10), col = "gray90")
segments(seq(from=0, to=20), rep(0, 10), seq(from=0, to=20),
rep(10, 10), col = "gray90")
# add points
points(x, y, pch = 20)
# vertical error bars
arrows(x0 = x, y0 = y - y_err, x1 = x, y1 = y + y_err, angle = 90,
col = "gray20", code = 3, length = 0.05, lwd = 0.4)
# horizontal error bars
arrows(x0 = x - x_err, y0 = y, x1 = x + x_err, y1 = y, angle = 90,
col = "gray20", code = 3, length = 0.05, lwd = 0.4)
# turn off graphic parameters
par(op)