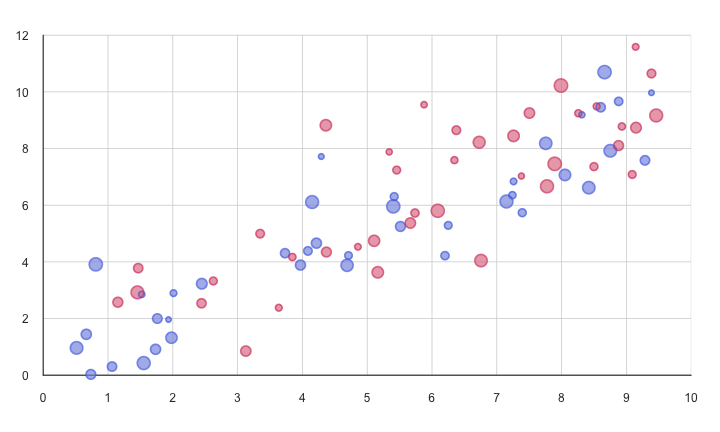
# ======================================================== # Data # ======================================================== # setting seed for random numbers set.seed(1111)# random numbers for x-y coordinates x=runif(80,0.5,9.5)y=x+rnorm(80,0,1.5)y[y<0]=y[y<0]+runif(1,1.5,2)y[y>10]=y[y>10]-runif(1,1,2)# random numbers for point sizes size=runif(80,1,2.5)# factor with 2 categories group=gl(2,40)# colors col_group<-col_border<-rep("",80)col_group[group==1]="#8595E1AA"col_group[group==2]="#E07B91AA"col_border[group==1]="#4A6FE3AA"col_border[group==2]="#D33F6AAA"# ======================================================== # Plot # ======================================================== # set graphic margins op=par(mar=c(3,3,1.5,2))# call new plot plot.new()# define plot window plot.window(xlim=c(0,10),ylim=c(0,12),xaxs="i")# add horizontal grid lines abline(h=seq(from=0,to=12,by=2),col="lightgray")# add vertical grid lines (don't use abline because it misbehaves) segments(0:12,rep(0,12),0:12,rep(12,12),col="lightgray")# add axes axis(side=1,pos=0,at=seq(from=0,to=10,by=1),col="gray20",lwd.ticks=0,cex.axis=1,col.axis="gray20",lwd=1.5)axis(side=2,pos=0,at=seq(from=0,to=12,by=2),col="gray20",las=2,lwd.ticks=0,cex.axis=1,col.axis="gray20",lwd=1.5)# add points with color points(x,y,pch=19,col=col_group,cex=0.9*size)# colored border of points points(x,y,pch=1,col=col_border,lwd=2,cex=size)# turn off par par(op)