# ========================================================================
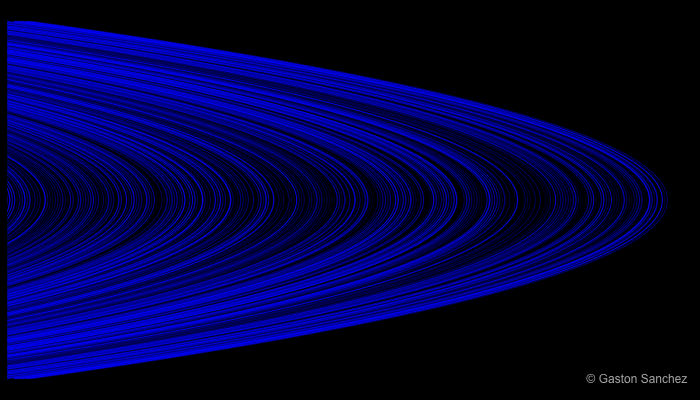
# Saturn blue rings
# ========================================================================
# generate pairs of x-y values
x <- seq(-50, 50, by = 1)
y <- -(x^2)
png("blue_rings.png", width = 700, height = 400)
# set graphic margins
op <- par(bg = 'black', mar = rep(0.5, 4))
# start plotting
plot(y, x, type = 'n')
lines(y, x, lwd = 3*runif(1),
col = hsv(0.65, 1, 1, alpha = runif(1, 0.5, 0.9)))
for (i in seq(10, 4000, 10))
{
lines(y - i, x, lwd = 2*runif(1),
col = hsv(0.65, 1, 1, alpha = runif(1, 0.3, 0.9)))
}
# signature
legend("bottomright", legend = "© Gaston Sanchez", bty = "n",
text.col = "gray70")
# reset par
par(op)
dev.off()