# ========================================================================
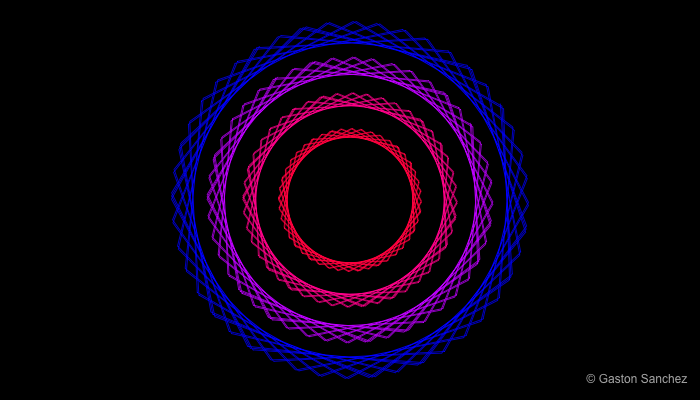
# Concentric circles
# ========================================================================
# generate x-y values
theta <- 1:100
x <- sin(theta)
y <- cos(theta)
png("concentric_circles.png", width = 700, height = 400)
# set graphic parameters
op <- par(bg = 'black', mar = rep(0.5, 4))
# open plot
plot.new()
plot.window(xlim = c(-1, 1), ylim = c(-1, 1), asp = 1)
# add lines
lines(x, y, col = hsv(0.65, 1, 1))
lines(0.8 * x, 0.8 * y, col = hsv(0.8, 1, 1))
lines(0.6 * x, 0.6 * y, col = hsv(0.9, 1, 1))
lines(0.4 * x, 0.4 * y, col = hsv(0.95, 1, 1))
# sign
legend("bottomright", legend = "© Gaston Sanchez", bty = "n",
text.col = "gray70")
# reset par
par(op)
dev.off()