# =============================================================
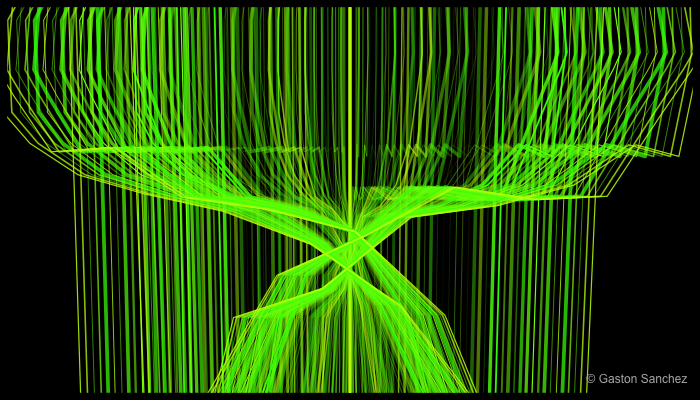
# Lemon Cords
# =============================================================
# generate x-y values
set.seed(1234)
theta <- seq(-2*pi, 2*pi, length = 50)
x <- sin(theta) + cos(theta)
y <- 1 / tan(theta) + runif(50)
png("lemon_cords.png", width = 700, height = 400)
# set graphical parameters
op <- par(bg = "black", mar = rep(0.5, 4))
# plot
plot(x, y, type = "n", xlim = c(-2, 2), ylim = c(-2, 2))
for (i in seq(0, pi/2, length = 40)) {
lines(i*x, y, lwd = 5*runif(1),
col = hsv(runif(1,0.2,0.3), 1, 1, runif(1,.3)))
}
# signature
legend("bottomright", legend = "© Gaston Sanchez", bty = "n",
text.col = "gray70")
# reset par
par(op)
dev.off()