# ========================================================================
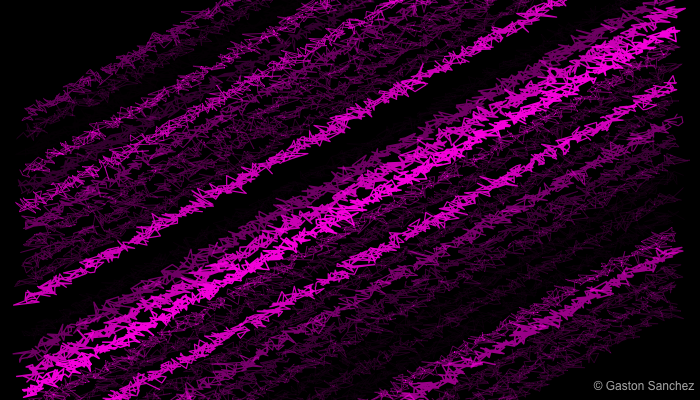
# Pink Barbs
# ========================================================================
# generate pairs of x-y values
x <- seq(1, 100, length = 1000)
y <- x + rnorm(1000)
png("pink_barbs.png", width = 700, height = 400)
# set graphical paramters
op <- par(bg = "black", mar = rep(0, 4))
# plot
plot(x, y, type = 'n')
for (i in seq(-80, 70, by = 5))
{
lines(x + rnorm(1000), x + i + rnorm(1000, 2), pch = 19,
col = hsv(0.85, 1, 1, runif(1000)),
lwd = sample(seq(0.3, 2, length = 20), 1))
}
# signature
legend("bottomright", legend = "© Gaston Sanchez", bty = "n",
text.col = "gray70")
# reset par
par(op)
dev.off()