# ========================================================================
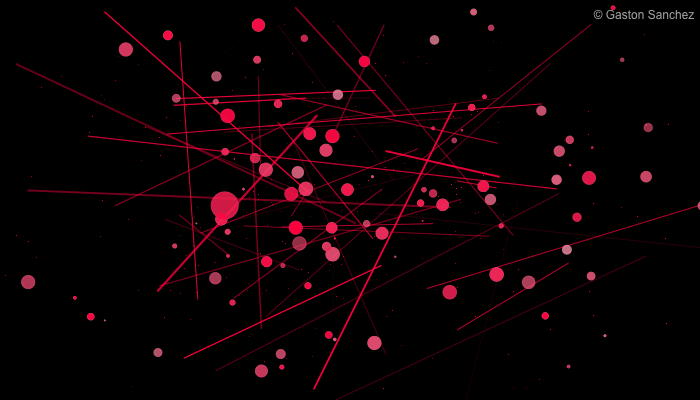
# Pink bubbles
# ========================================================================
# generate pairs of x-y values
x <- rnorm(100)
y <- rnorm(100)
z <- rnorm(200)
w <- rnorm(200)
# colors
whites <- hsv(h = 0, s = 0, v = 1, alpha = runif(100, 0.3, 0.7))
pinks <- hsv(h = 0.95, s = 1, v = 1, alpha = runif(100, 0.3, 1))
png("pink_bubbles.png", width = 700, height = 400)
# set graphical parameters
op <- par(bg = 'black', mar = rep(0, 4))
# plot
plot(x, y, axes = FALSE, xlim = c(-2, 2), ylim = c(-2, 2), type = 'n')
x0 <- sample(c(x, w), 50)
y0 <- sample(c(y, z), 50)
x1 <- sample(c(x, w), 50)
y1 <- sample(c(y, z), 50)
segments(x0, y0, x1, y1, col = pinks, lwd = 3*runif(50))
points(w, z, pch = ".", col = pinks)
points(x, y, pch = 19, cex = sizes, col = whites, bg = whites)
points(x, y, pch = 19, cex = sizes, col = pinks, bg = pinks)
# signature
legend("topright", legend = "© Gaston Sanchez", bty = "n",
text.col = "gray70")
# reset par
par(op)
dev.off()