# ========================================================================
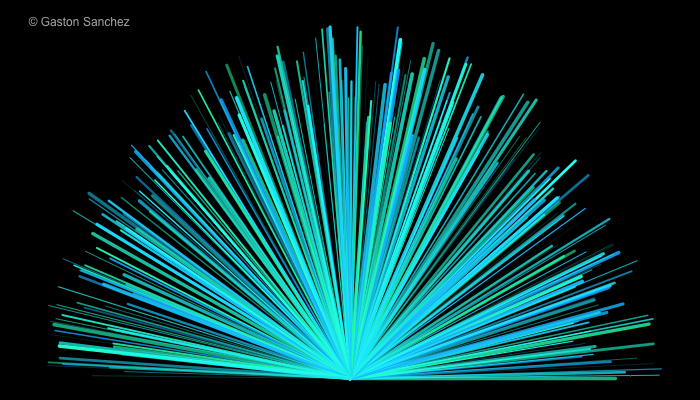
# Rays
# ========================================================================
# generate pairs of x-y values
theta <- seq(0, pi, length = 300)
x <- cos(theta)
y <- sin(theta)
png("rays.png", width = 700, height = 400)
# set graphical parameters
op <- par(bg = "black", mar = rep(0.5, 4))
# plot
plot(x, y, type = 'n')
segments(rep(0, 299), rep(0, 299), x[1:299] * runif(299, 0.7),
y[1:299] * runif(299, 0.7),
col = hsv(runif(299, 0.45, 0.55), 1, 1, runif(299, 0.5)),
lwd = 5*runif(299))
# signature
legend("topleft", legend = "© Gaston Sanchez", bty = "n",
text.col = "gray70")
# reset par
par(op)
dev.off()