# ========================================================================
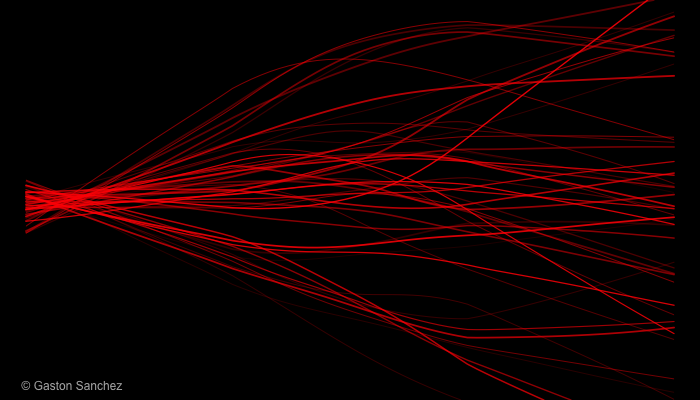
# Red yarns
# ========================================================================
# population size
size <- 250
# number of yarns
n <- 50
# generations
gens <- 70
# colors
reds <- hsv(h = 0, s = 1, v = 1, alpha = runif(n, 0.2, 0.9))
png("red_yarns.png", width = 700, height = 400)
# set graphical parameters
op <- par(bty = "n", mar = c(0, 0, 0, 0), bg = 'black')
# plot
plot(1:gens, rep(0, gens), type = 'l', ylim = c(0.15, 0.85), axes = FALSE)
for (j in 1:n)
{
# probability
p <- 0.5
freq <- c(rep(p, 10), rep(NA, gens - 10))
for (i in 11:gens)
{
# binomial number
aux <- rbinom(1, size, p)
p <- aux / size
freq[i] <- p
}
lwds <- sample(seq(0.5, 2.5, by = 0.15), 1)
# use loess
temp <- lowess(freq ~ 1:gens)
lines(temp$x, temp$y, col = reds[j], lwd = lwds)
}
# signature
legend("bottomleft", legend = "© Gaston Sanchez", bty = "n",
text.col="gray70")
# reset par
par(op)
dev.off()