# ========================================================================
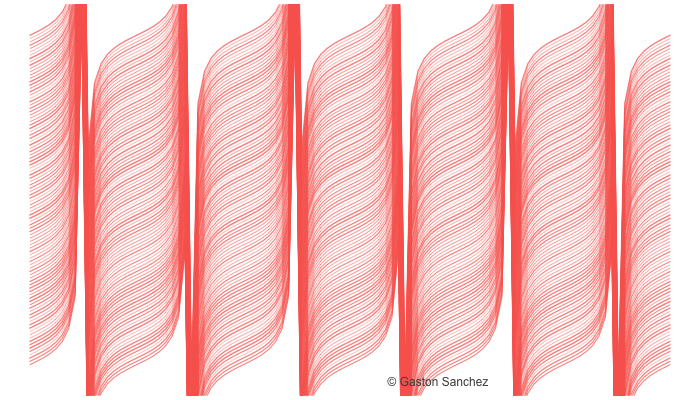
# Vertical Waves
# ========================================================================
# generate pairs of x-y values
x <- seq(0, 6 * pi, length = 100)
y <- tan(x)
png("vertical_waves.png", width = 700, height = 400)
# set graphical parameters
op <- par(bg = "white", mar = rep(0.3, 4))
# plot
plot(x, y, type = "n", ylim = c(-11, 11), axes = FALSE)
for (i in seq(-10, 10, length = 100))
{
lines(x, y + i, col = "#f9675dBB", lwd = 2 * runif(1, 0.3))
}
# signature
legend("bottomright", legend="© Gaston Sanchez", bty="n",
text.col = "gray30", adj = 2)
# reset par
par(op)
dev.off()