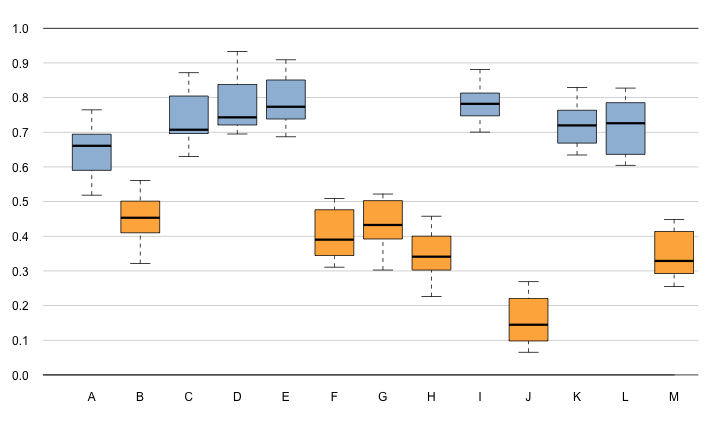
# ======================================================== # Data # ======================================================== # setting seed for random numbers set.seed(777)# generate random data Data=matrix(NA,15,13)for(iin1:13){Data[,i]=(3/4)*runif(1)+runif(15)/4}dimnames(Data)=list(1:15,toupper(letters[1:13]))# colors cols=rep("#FEB24C",13)cols[colMeans(Data)>0.5]="#9EBCDA"# ======================================================== # Plot # ======================================================== # set graphic margins op=par(mar=c(3,3,1,1.5))# call new plot plot.new()# define plot window plot.window(xlim=c(0,13.5),ylim=c(0,1),xaxs="i")# add x axis axis(side=1,pos=0,at=0:13,labels=c("",colnames(Data)),lwd.ticks=0,cex.axis=1)# add y axis axis(side=2,pos=0,at=seq(from=0,to=1,by=0.1),lwd=0,las=2,cex.axis=1)# add horizontal lines abline(h=seq(from=0.1,to=1,by=0.1),col="gray80")abline(h=c(0,1))# boxplot boxplot(Data,col=cols,axes=FALSE,xlim=c(0,13),notch=FALSE,add=TRUE)# turn off par par(op)