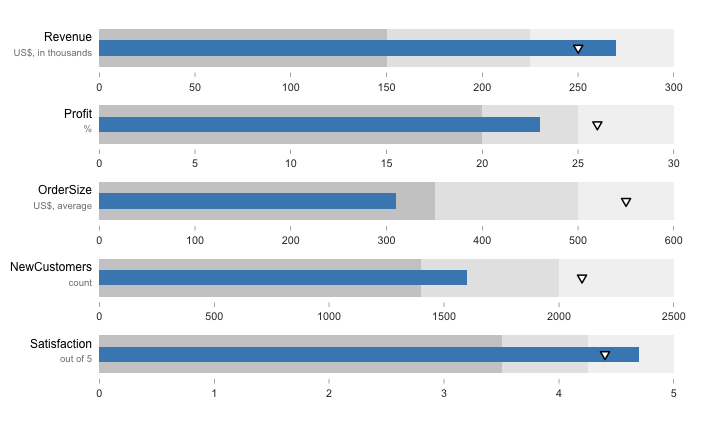
# ======================================================== # Data # ======================================================== # Bullet Chart data BC=data.frame(Satisfaction=c(4.7,4.4,3.5,4.25,5),NewCustomers=c(1600,2100,1400,2000,2500),OrderSize=c(310,550,350,500,600),Profit=c(23,26,20,25,30),Revenue=c(270,250,150,225,300),row.names=c("current","past","poor","satisfactory","good"))# units of measurement units=c("out of 5","count","US$, average","%","US$, in thousands")# number of tick marks ticks=c(6,6,7,7,7)# ======================================================== # Plot # ======================================================== # set graphic margins op=par(mar=c(2,6.5,1,2))# call new plot plot.new()# define plot window plot.window(xlim=c(-0.1,10.3),ylim=c(-0.2,4.5),xaxs="i")# add names mtext(names(BC),side=2,at=seq(0.4,4.4,1),las=2,cex=1,line=0.1)mtext(units,side=2,at=seq(0.2,4.2,1),las=2,col="gray50",cex=0.8,line=0.1)# add rectangles for(iin0:4){# maximum rectangle rect(0,i,10,i+0.5,border=NA,col="gray95")# add rectangles for satisfactory range xright_sat=(10*BC[4,i+1])/BC[5,i+1]rect(0,i,xright_sat,i+0.5,border=NA,col="gray90")# add rectangles for poor range xright_poor=(10*BC[3,i+1])/BC[5,i+1]rect(0,i,xright_poor,i+0.5,border=NA,col="gray80")# add bar for current value xright_cur=(10*BC[1,i+1])/BC[5,i+1]rect(0,i+0.15,xright_cur,i+0.35,border=NA,col="#4689BF")# add mark for past value xpast=(10*BC[2,i+1])/BC[5,i+1]points(xpast,i+0.25,pch=25,bg="white",lwd=2,cex=1.25)# add tick marks below rectangles text(x=seq(0,10,length=ticks[i+1]),y=i-0.25,col="gray20",labels=seq(0,BC[5,i+1],length=ticks[i+1]),cex=0.9)points(x=seq(0,10,length=ticks[i+1]),y=rep(i-0.1,ticks[i+1]),pch="|",cex=0.4)}# reset graphical parameters par(op)