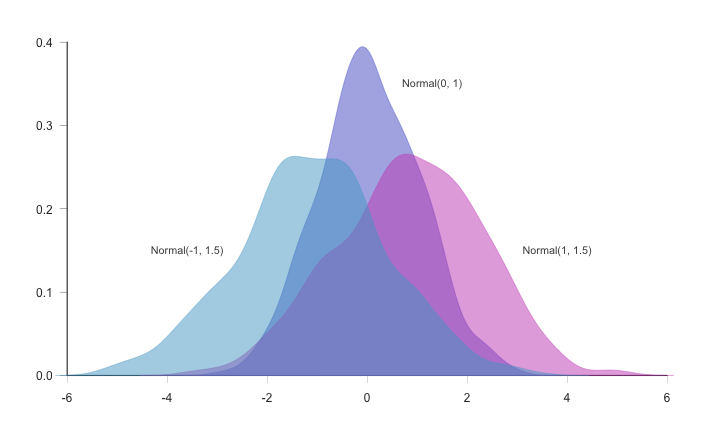
# ======================================================== # Data # ======================================================== # setting seed for random numbers set.seed(1111)# random normal distributions den1=density(rnorm(500))den2=density(rnorm(500,1,1.5))den3=density(rnorm(500,-1,1.5))# colors for each distribution col1=hsv(h=0.65,s=0.6,v=0.8,alpha=0.5)col2=hsv(h=0.85,s=0.6,v=0.8,alpha=0.5)col3=hsv(h=0.55,s=0.6,v=0.8,alpha=0.5)# ======================================================== # Plot # ======================================================== # set graphic margins op=par(mar=c(3,3,2,2))# call new plot plot.new()# plot window plot.window(xlim=c(-6,6),ylim=c(0,0.4))# add axes axis(side=1,pos=0,at=seq(from=-6,to=6,by=2),col="gray20",lwd.ticks=0.25,cex.axis=1,col.axis="gray20",lwd=1.5)axis(side=2,pos=-6,at=seq(from=0,to=0.4,by=0.1),col="gray20",las=2,lwd.ticks=0.5,cex.axis=1,col.axis="gray20",lwd=1.5)# density 1 polygon(den1$x,den1$y,col=col1,border=col1)# density 2 polygon(den2$x,den2$y,col=col2,border=col2)# density 3 polygon(den3$x,den3$y,col=col3,border=col3)# add legends text(1.3,0.35,labels="Normal(0, 1)",col="gray30",cex=0.9)text(3.8,0.15,labels="Normal(1, 1.5)",col="gray30",cex=0.9)text(-3.6,0.15,labels="Normal(-1, 1.5)",col="gray30",cex=0.9)# turn off par par(op)