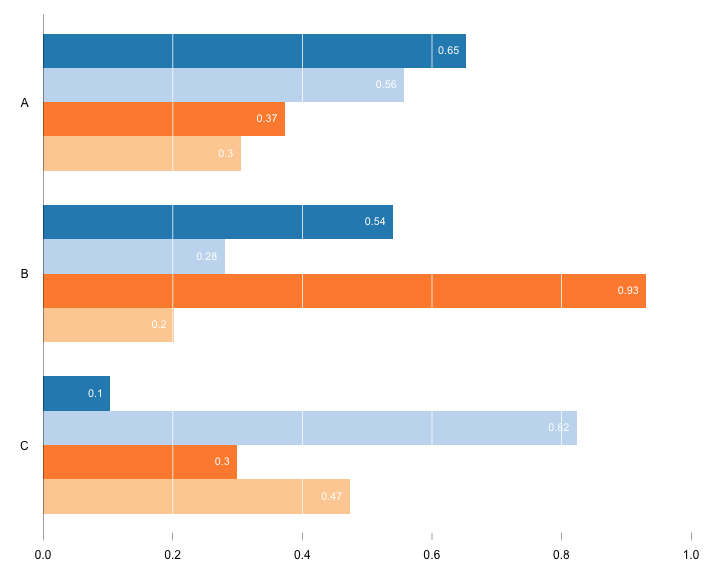
# ======================================================== # Data # ======================================================== # setting seed for random numbers set.seed(557)# data num_rows=4num_cols=3X=matrix(runif(num_rows*num_cols,0.1,1),nrow=num_rows,ncol=num_cols)colnames(X)=c("A","B","C")# colors (from light orange to dark blue) cols=c("#FDD0A2","#FD8D3C","#C6DBEF","#2B8CBE")# ======================================================== # Plot # ======================================================== # set graphic margins op=par(mar=c(3,3,1,2))# barplot barplot(X[,num_cols:1],beside=TRUE,horiz=TRUE,xlim=c(0,1),axes=FALSE,border=NA,names.arg=colnames(X)[num_cols:1],las=2,col=cols,cex.names=1)# add x axis axis(side=1,at=seq(from=0,to=1,by=0.2),lwd=0,lwd.ticks=0.5,cex.axis=1)# add y axis abline(v=0,col="black")# add vertical lines abline(v=seq(from=0.2,to=0.8,by=0.2),col="white")# location of values in bars ini=seq(1,num_rows*num_cols+num_rows-2)fin=seq(2,num_rows*num_cols+num_rows-1)locs=((ini+fin)/2)# add values in bars text(X[,1],y=locs[11:14],labels=round(X[,1],2),pos=2,col="white",cex=0.9)text(X[,2],y=locs[6:9],labels=round(X[,2],2),pos=2,col="white",cex=0.9)text(X[,3],y=locs[1:4],labels=round(X[,3],2),pos=2,col="white",cex=0.9)# turn off par par(op)