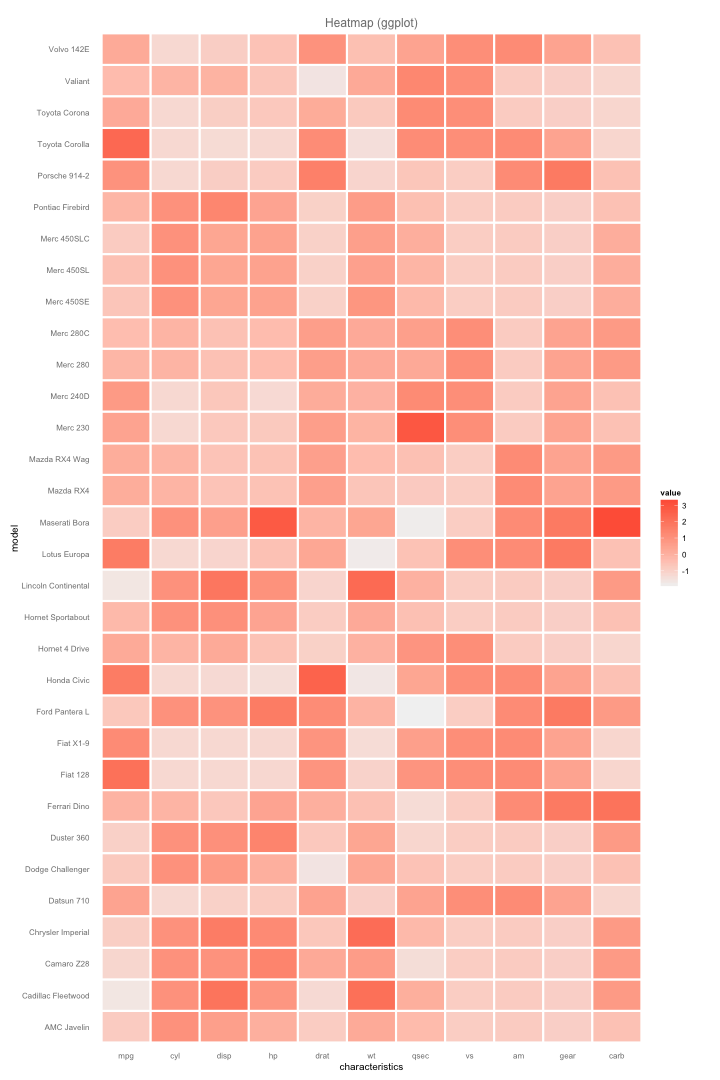
# ========================================================
# Data: example with mtcars dataset
# ========================================================
# load RColorBrewer
library(ggplot2)
library(reshape)

# load data 'mtcars'
data(mtcars)

# scale data by "columns"
carsdf = data.frame(scale(mtcars))
carsdf$model = rownames(mtcars)
cars_melt = melt(carsdf, id.vars = "model")


# ========================================================
# Plot
# ========================================================
ggplot(data = cars_melt, aes(x = variable, y = model)) +
  geom_tile(aes(fill = value), color = "white", size = 1) +
  scale_fill_gradient(low = "gray95", high = "tomato") +
  xlab("characteristics") +
  theme_grey(base_size = 10) +
  ggtitle("Heatmap (ggplot)") +
  theme(axis.ticks = element_blank(),
        panel.background = element_blank(),
        plot.title = element_text(size = 12, colour = "gray50"))

