# ========================================================
# Data
# ========================================================
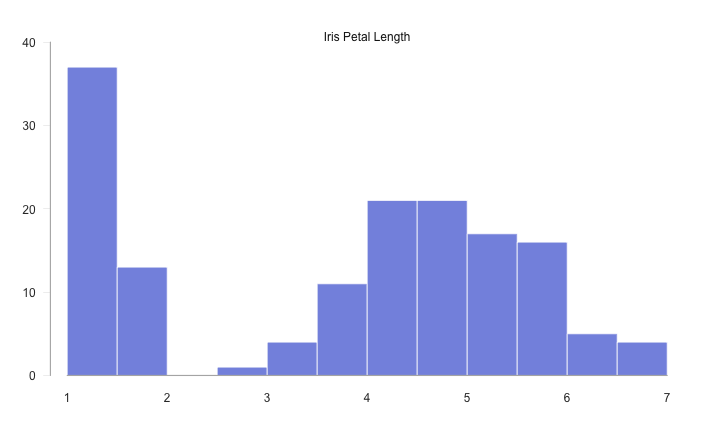
# iris dataset
data(iris)
# ========================================================
# Plot
# ========================================================
# set graphic margins
op = par(mar = c(3, 3, 2, 2))
# histogram
hist(iris$Petal.Length, ylim=c(0, 40), col = "#8595E1",
border = "white", main = "", xlab = "", ylab = "", axes = FALSE)
# add axes
axis(side = 1, pos = 0, at = seq(from=1, to=7, by=1), col = "gray70",
lwd.ticks = 0, cex.axis = 1, col.axis = "gray20", lwd = 1.5)
axis(side = 2, at = seq(from=0, to=40, by=10), col = "gray70",
las = 2, lwd.ticks = 0.25, cex.axis = 1, col.axis = "gray20",
lwd = 1.5, line = -0.5)
# add title
mtext("Iris Petal Length", side=3, col="gray10", line=-1, cex=1)
# turn off par
par(op)