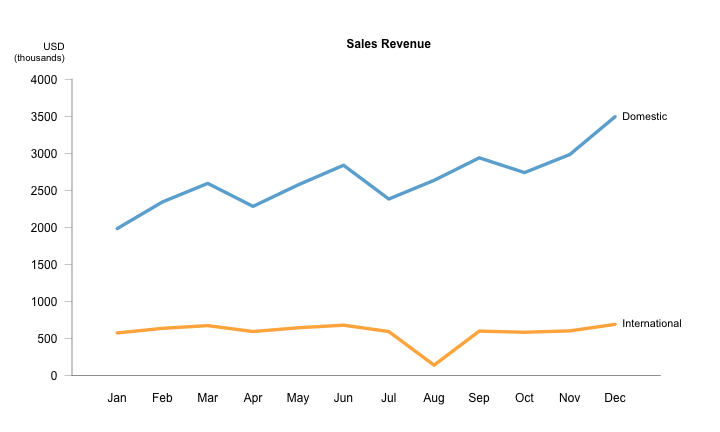
# ======================================================== # Data from "Now you see it" by Stephen Few # ======================================================== # Data domes=c(1983,2343,2593,2283,2574,2838,2382,2634,2938,2739,2983,3493)inter=c(574,636,673,593,644,679,593,139,599,583,602,690)# Data frame of sales revenue SR=data.frame(Domestic=domes,International=inter,row.names=substr(month.name,1,3))# ======================================================== # Plot # ======================================================== # set graphic margins op=par(mar=c(3,5,2,1))# call new plot plot.new()# define plot window plot.window(xlim=c(0,14),ylim=c(0,4500),xaxs="i")# add axis axis(side=1,pos=0,at=0:13,labels=c("",rownames(SR),""),lwd.ticks=0,col="gray50",cex.axis=1)axis(side=2,pos=0,at=seq(from=0,to=4000,by=500),las=2,lwd.ticks=0.5,col="gray50",cex.axis=1,line=0.1)# add lines lines(1:12,SR$Domestic,col="#6BAED6",lwd=4.5)lines(1:12,SR$International,col="#FEB24C",lwd=4.5)# add legends text(12,SR$Domestic[12],labels="Domestic",cex=0.9,pos=4)text(12,SR$International[12],labels="International",cex=0.9,pos=4)# add y-axis legend mtext("USD",side=2,at=4450,las=2,cex=0.85,line=0.5)mtext("(thousands)",side=2,at=4300,las=2,cex=0.8,line=0.5)# add title mtext("Sales Revenue",side=3,line=-1.5,font=2)# turn off par par(op)