# ========================================================
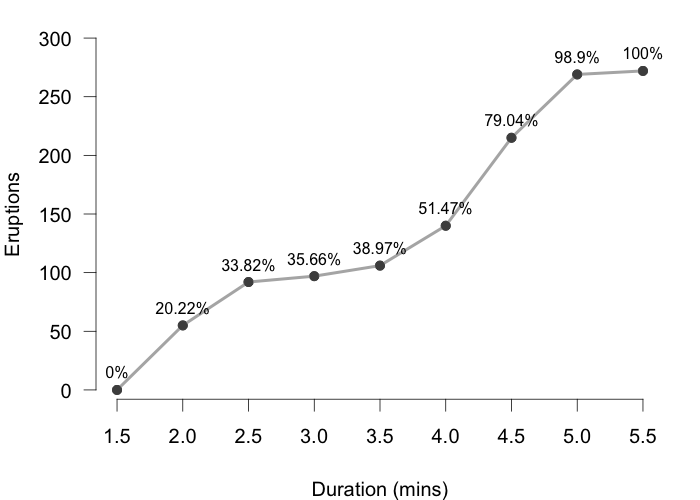
# Data: Old Faithful Geiser
# ========================================================
data("faithful")
# Auxiliary function that gets cumulative frequencies
# (wrapper of the hist() function)
cum_freq <- function(x, breaks = "Sturges", include.lowest = TRUE,
right = TRUE)
{
x_hist <- hist(x, breaks = breaks, right = right,
include.lowest = include.lowest, plot = FALSE)
breaks <- x_hist$breaks
cumfreq = c(0, cumsum(x_hist$counts))
cumprop = round(100 * cumfreq / max(cumfreq), 2)
list(breaks = breaks,
cumfreq = cumfreq,
cumprop = cumprop)
}
# cumulative duration
cumdur <- cum_freq(faithful$eruptions)
# ========================================================
# Plot Ogive
# ========================================================
png("ogive-faithful.png", width = 700, height = 500, pointsize = 20)
# set margins
op = par(mar = c(4.5, 4, 1, 1.5))
# call plot
plot(cumdur$breaks, cumdur$cumfreq, axes = FALSE,
xlab = "Duration (mins)", ylab = "Eruptions",
ylim = c(0, 300))
axis(side = 1, at = cumdur$breaks, line = -0.2)
axis(side = 2, at = seq(0, 300, 50), las = 1)
lines(cumdur$breaks, cumdur$cumfreq,
lwd = 4, col = "gray70")
points(cumdur$breaks, cumdur$cumfreq,
pch = 19, col = "gray30", cex = 1)
text(cumdur$breaks, cumdur$cumfreq,
pos = 3, cex = 0.8, xpd = TRUE,
labels = paste(cumdur$cumprop, "%", sep = ""))
# turn off par
par(op)
dev.off()