# ========================================================
# Data
# ========================================================
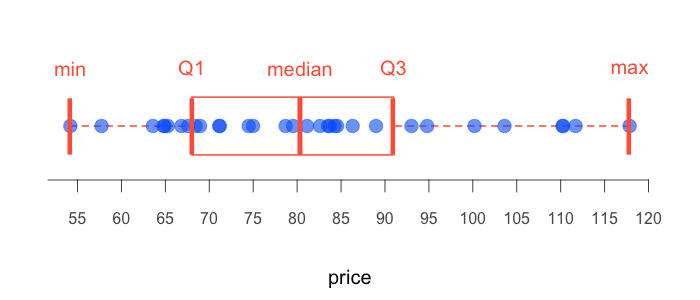
# price of tickets
tickets <- c(
110.20, 117.84, 111.69, 103.60, 110.28, 94.80, 100.19,
93.01, 88.98, 84.55, 81.13, 82.61, 83.54, 74.99, 84.27,
86.32, 83.71, 78.69, 74.49, 71.21, 79.56, 71.14, 64.80,
65.28, 67.60, 68.96, 68.44, 64.92, 63.59, 57.75, 66.84,
54.20)
# ========================================================
# Plot
# ========================================================
png("points-boxplot.png", width = 700, height = 300,
pointsize = 20)
op <- par(mar = c(4,2,2,2))
boxplot(tickets, horizontal = TRUE, axes = FALSE,
border = "tomato", lwd = 2)
axis(side = 1, at = seq(50, 120, 5), cex.axis = 0.8,
line = -1, col.axis = "gray35")
mtext("price", side = 1, line = 2.5)
points(tickets, rep(1, length(tickets)), pch = 19,
col = hsv(0.6, 1, 1, 0.6), cex = 1.5)
points(quantile(tickets, probs = c(0, 0.25, 0.5, 0.75, 1), type = 2),
rep(1, 5), pch = "|", col = "tomato", cex = 3)
text(quantile(tickets, probs = c(0, 0.25, 0.5, 0.75, 1), type = 2),
rep(1.4, 5), labels = c("min", "Q1", "median", "Q3", "max"),
col = "tomato", cex = 1)
par(op)
dev.off()