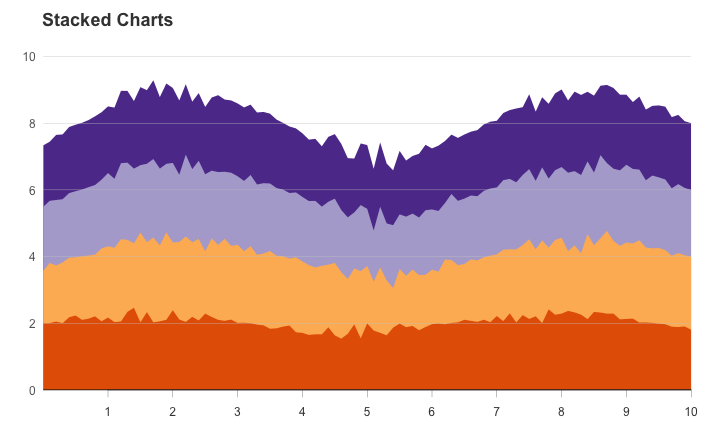
# ======================================================== # Data # ======================================================== # setting seed for random numbers set.seed(222)# generate numbers for curves x=seq(0,10,0.1)y=matrix(NA,length(x),4)for(iin1:4){y[,i]=sin(x)*runif(length(x))*0.5+2}# colors cols=c("#E66101","#FDB863","#B2ABD2","#5E3C99")# ======================================================== # Plot # ======================================================== # set graphic margins op=par(mar=c(2,3,3,2))# call new plot plot.new()# define plot window plot.window(xlim=c(0,10),ylim=c(0,10),xaxs="i")# draw shaded areas for(iin4:2){polygon(c(x,rev(x)),c(rep(0,length(x)),rowSums(y[,1:i])),col=cols[i],border=NA)}polygon(c(x,rev(x)),c(rep(0,length(x)),rev(y[,1])),col=cols[1],border=NA)# add x axis axis(side=1,pos=0,at=seq(1,10,1),col="gray40",lwd.ticks=0.5,cex.axis=1,col.axis="gray25")segments(0,0,10,0)# numbers in y axis mtext(seq(from=0,to=10,by=2),side=2,at=seq(from=0,to=10,by=2),col="gray40",line=0.5,las=2,cex=1)# add step line abline(h=seq(from=2,to=10,by=2),col="gray80",lwd=0.5)# add title mtext("Stacked Charts",side=3,at=1,col="gray25",line=1,cex=1.5,font=2)# turn off par par(op)