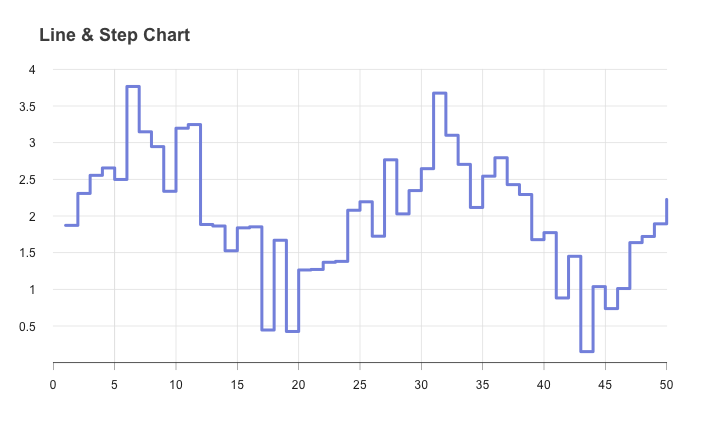
# ======================================================== # Data # ======================================================== # setting seed for random numbers set.seed(121)# random numbers for coordinates y=2+sin(seq(from=-2*pi,to=2*pi,length=50))+rnorm(50,0,0.5)x=1:length(y)# ======================================================== # Plot # default: plot(x, y, type="s") # ======================================================== # set graphic margins op=par(mar=c(4,2,4,2))# call new plot plot.new()# define plot window plot.window(xlim=c(0,50),ylim=c(0,4))# add horizontal grid lines (don't use abline because it misbehaves) segments(rep(0,9),seq(from=0,to=4,by=0.5),rep(50,9),seq(from=0,to=4,by=0.5),col="gray90")# add vertical grid lines (don't use abline because it misbehaves) segments(seq(from=5,to=45,by=5),rep(0,10),seq(from=5,to=45,by=5),rep(4,10),col="gray90")# add x axis axis(side=1,pos=0,at=seq(from=0,to=50,by=5),col="gray20",lwd.ticks=0.5,cex.axis=1,col.axis="gray15")# numbers in y axis mtext(seq(from=0.5,to=4,by=0.5),side=2,at=seq(from=0.5,to=4,by=0.5),col="gray15",las=2,cex=1,line=-0.5)# add step line lines(x,y,type="s",lwd=4,col="#8595E1")# add title mtext("Line & Step Chart",side=3,at=5,col="gray30",line=1,cex=1.5,font=2)# turn off par par(op)