05:00
STAT 20: Introduction to Probability and Statistics
In groups of 3, take turns introducing yourselves to one another by providing the info listed on the handout (your name, hometown, etc).
Each person should finish with a handout filled-in with info on their groupmates. Make sure you save this for next week!
05:00
What’s going on with crashes in California?
01:00
01:00
01:00
Understand
the World
Data
Understand
the World
Data
We can call the process of:
This lifecycle involves constructing and critiquing claims made using data: which is the main goal of our course!
To learn to critique and construct
claims made using data.
To learn to critique and construct
claims made using data.
To learn to critique and construct
claims made using data.
To learn to critique and construct
claims made using data.
To learn to critique and construct
claims made using data.
To learn to critique and construct
claims made using data.
To learn to critique and construct
claims made using data.

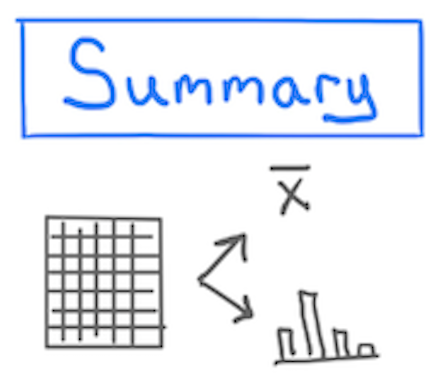
A numerical, graphical, or verbal description of an aspect of data that is on hand.
Example
Using data collected from students in Stat 20 (Fall 2025), the proportion of students—in this class—born in California is 75%.

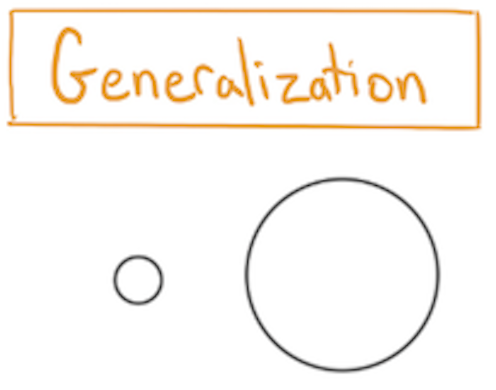
A numerical, graphical, or verbal description of a broader set of units than those on which data was been recorded.
Example
Using data collected from students in Stat 20 (Fall 2025), the proportion of UC Berkeley students born in California is 75%.

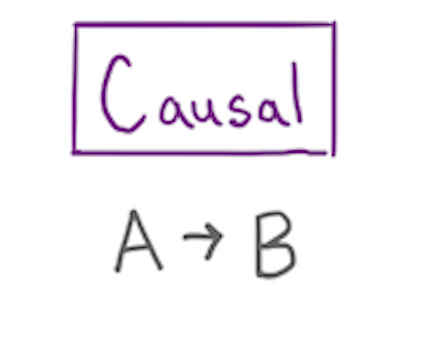
A claim that changing the value of one variable will influence the value of another variable.
Example
Data from a Randomized Controlled Experiment shows that lab scores of STAT 20 students who attend Group Tutoring sessions are 20% higher than those who don’t.

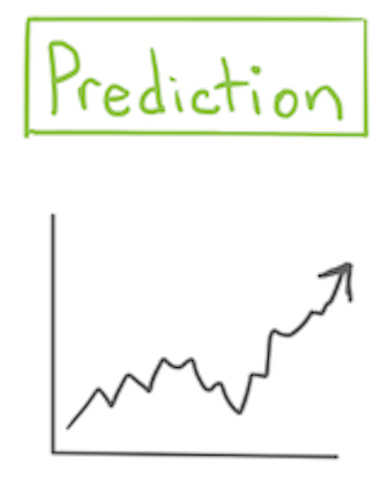
A guess about the value of an unknown variable, based on other known variables.
Example
Based on STAT 20 data from the past three semesters, I predict that the median score on quiz 1 will be 80%.
05:00
05:00
R: A free, open-source programming language designed for statistics and data science purposes.
RStudio: A software through which you can run R code, compose documents, and easily keep track of your coding session. You can also store and manage your files.
R allows all of the standard arithmetic operations.
You can create/save objects using the assignment operator <-. This is the equivalent of = in other programming languages.
In order to be recognized as a valid object name, you have to follow certain conventions; namely, the object name should begin with a letter.
| good names | names that cause errors |
|---|---|
a |
1trial |
b |
$ |
FOO |
^mean |
my_var |
my var |
A vector is the simplest structure used in R to store data. It can be created using the function c().
Click the link below …
15:00
Lab Questions will be posted to the course website.
You’ll author your Lab Reports as Quarto Documents that blend text and code. They should contain only answers.
Render your .qmd file to a .pdf file then download that file from RStudio to your computer.
Go to Gradescope and upload your .pdf lab report, being sure to assign questions to the pages.
