35:00
From Samples to Populations
STAT 20: Introduction to Probability and Statistics
Adapted by Gaston Sanchez
Vocabulary
Terms
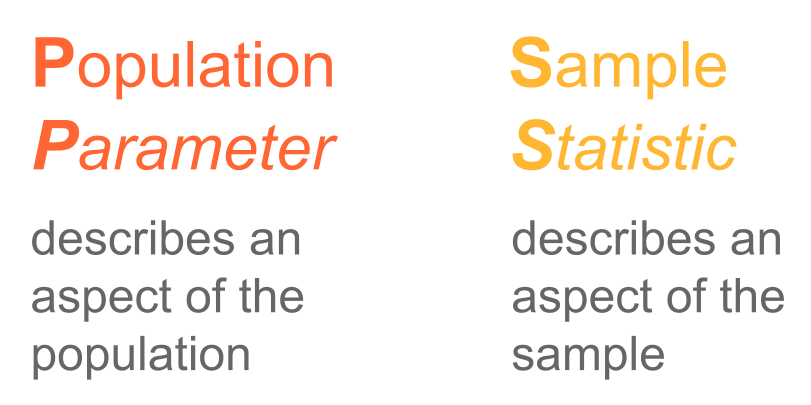
- Sample
- Population
- Statistic
- Parameter
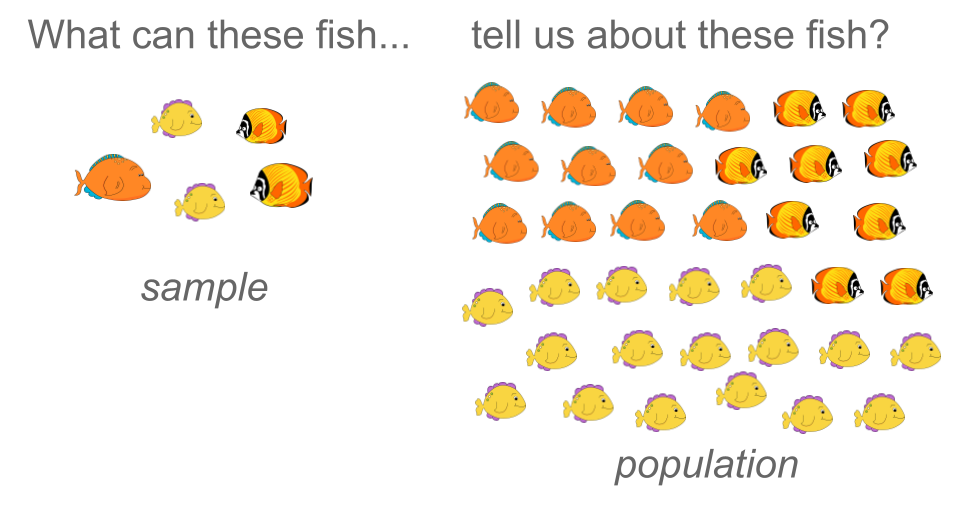
Populations and Samples
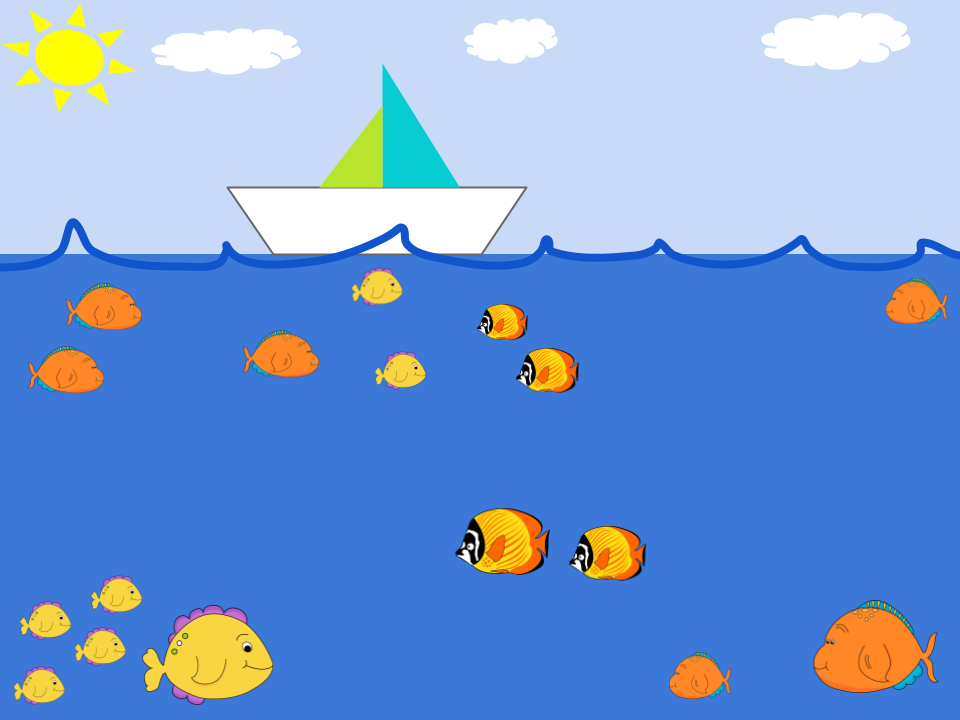
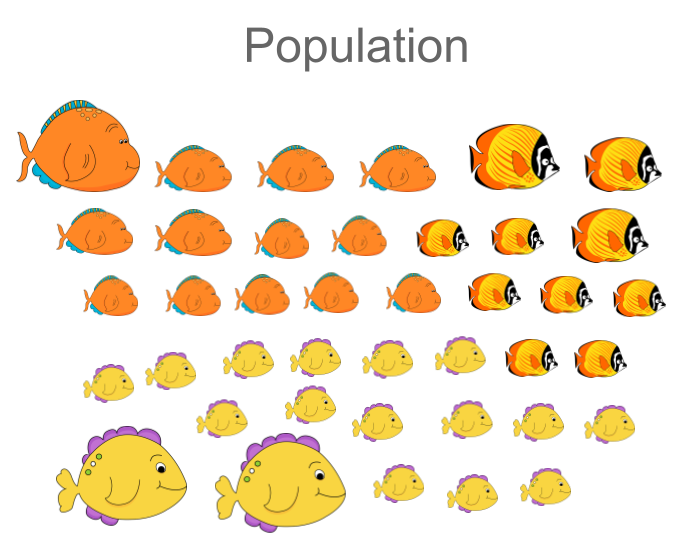
Interested in
Often we want to know something about the population:
Proportion of female fish (out of all fish)
Proportion of male fish (out of all fish)
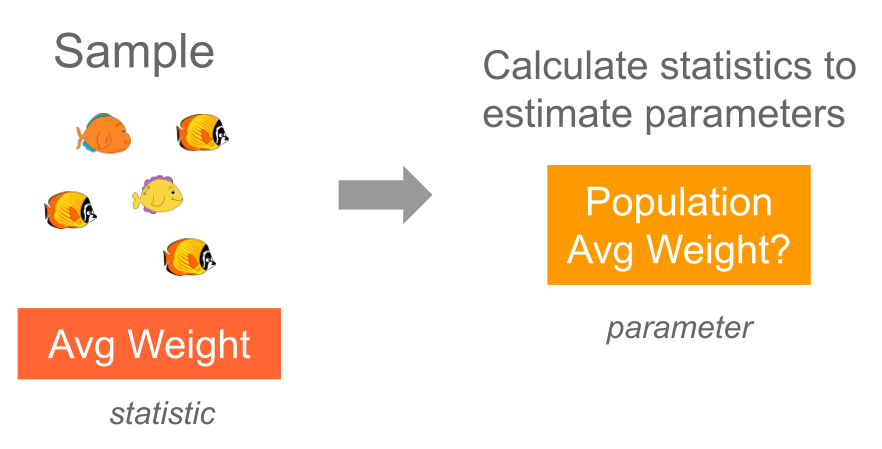
Average weight (of all fish)
Average number of fins (of all fish)
We call these Parameters
Typical limitations
But we don’t have access to all of its individuals
Hard to observe population
Not enough time
Not enough money
Not enough resources
ETC
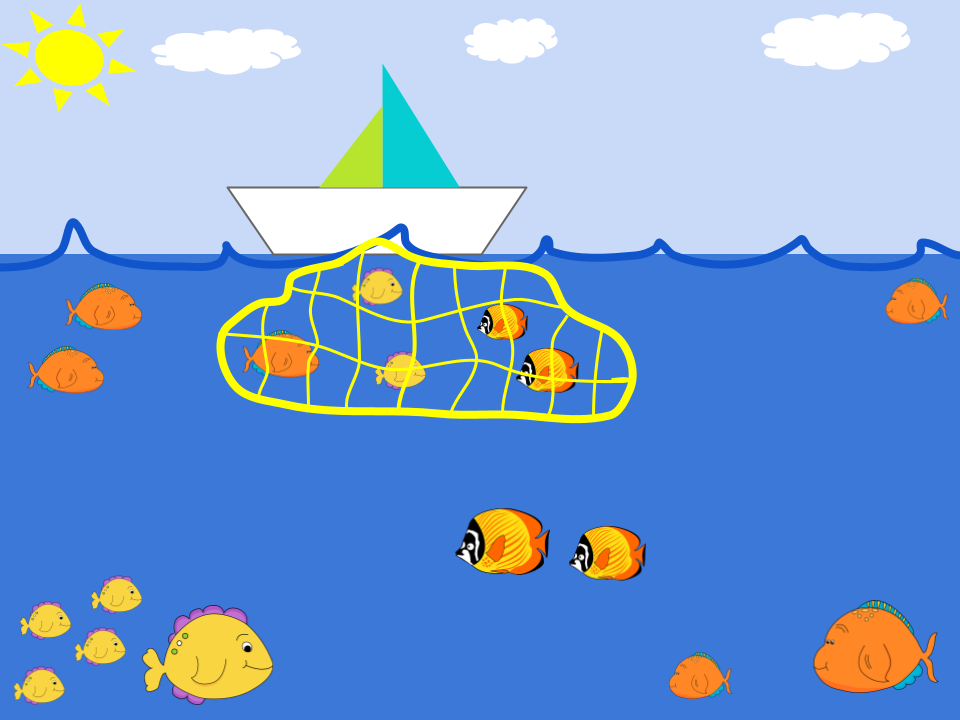
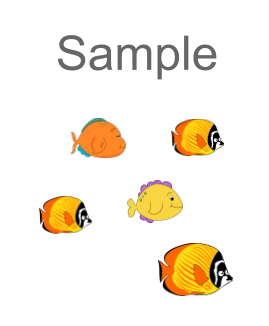
From the sample …
We can catch some fish and calculate:
Proportion of female fish (in sample)
Proportion of male fish (in sample)
Average weight (in sample)
Average number of fins (in sample)
We call these Statistics
Estimation Idea
Estimation (Generalization) Idea
To help you remember
Estimation
Estimating Parameters
Estimate parameters:
- population mean
- population proportion
BTW:
- We never estimate statistics
- Watch out for estimation errors
Sampling (in practice)
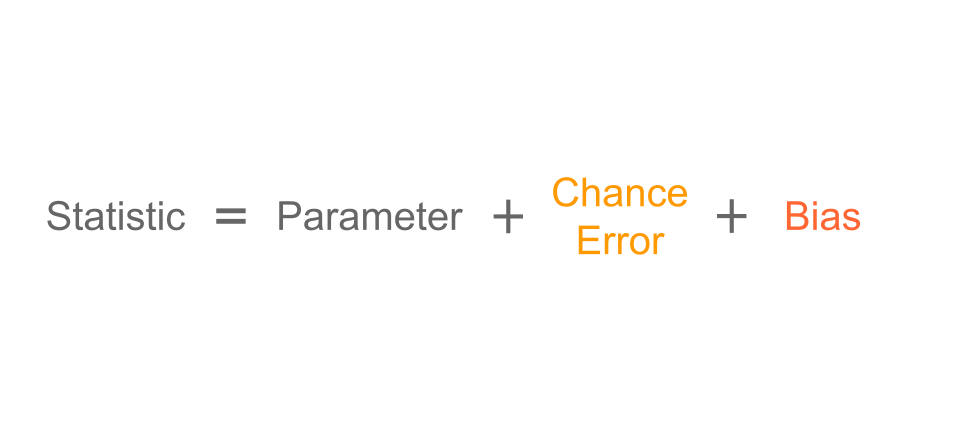
Sampling: Sources of Error
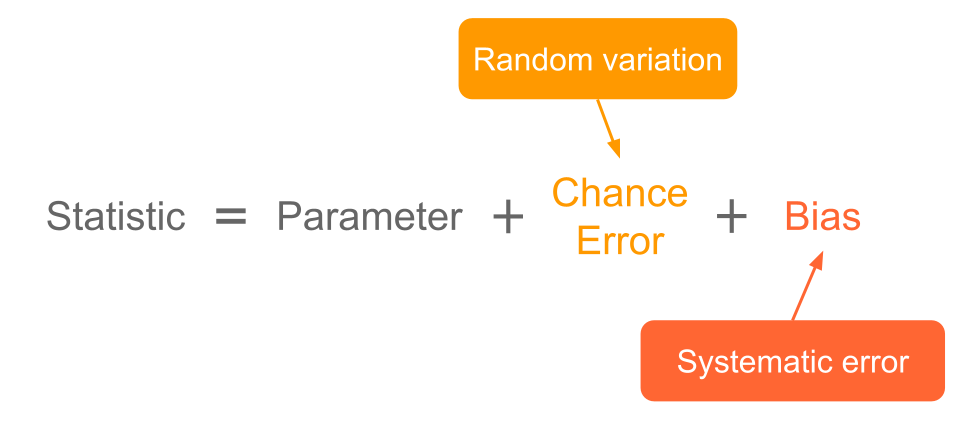
Sources of Error: Bias and Variance
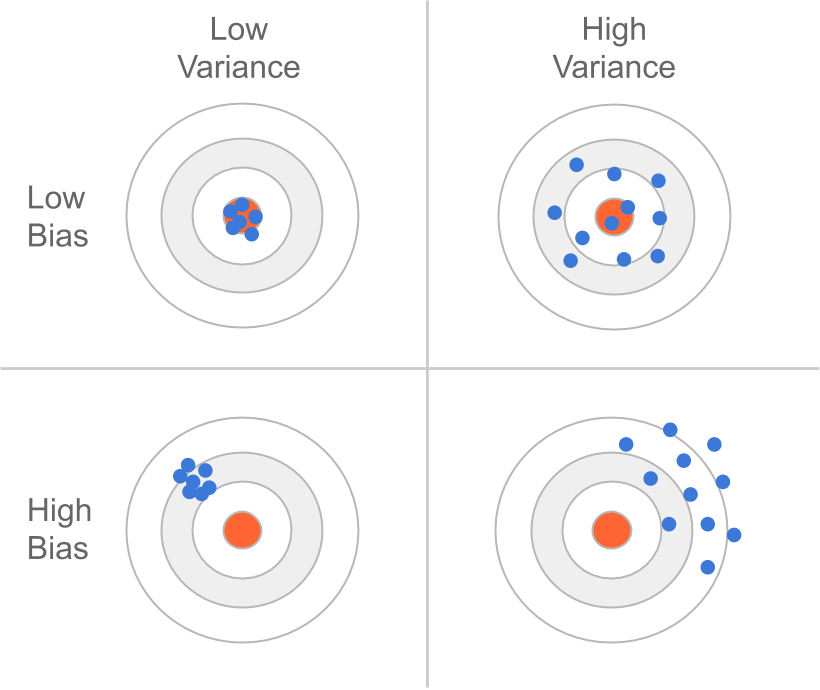
Types of Bias
- Selection Bias: When not all units in the population are equally likely to be selected for the sample.
Measurement Bias: When your process of measuring a variable systematically misses the target in one direction.
- when questions are confusingly worded or leading,
- when respondents may not be comfortable answering honestly.
- Non-response Bias: When certain units originally selected for the sample fail to provide data
Solution (ideal): Simple Random Sample (SRS)
Types of Variation
- Sampling Variability: the variability from one sample to the next
- Measurement Variability: When we take multiple measurements on the same object and we get variations in measurements from one sample to the next.
Sampling Distribution
What is a Sampling Distribution?
Sampling Distribution is the distribution of a statistic upon repeated sampling.
No longer are we considering the (usually unknowable) distribution of the population or the observed distribution of the data
Usually the sampling distribution is a hypothetical thing: what would our statistic have looked like if we had taken a different sample of data?
Demo
Worksheet
Lab-4: Elections
35:00