Football-shaped scatterplot
Posted on March 23, 2016
Using R to plot a football-shaped scatter diagram.
Introduction
In all my Introduction to Statistics courses I need to discuss topics such as association between two quantitative variables, correlation coefficient, and of course scatter diagrams.
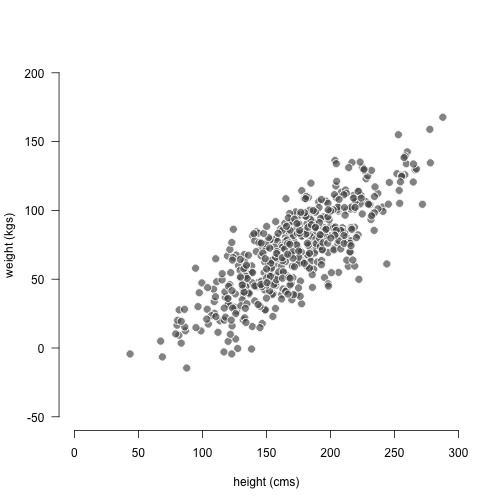
A particular type of scatter diagrams involves what some of my colleagues at UC Berkeley call a football-shaped scatterplot. This is the generic term we used to indicate that two (quantitative) variables X and Y, supposedly distributed in fairly normal way, have a linear association. Moreover, the diagram shows homoscedasticity (same amount of vertical spread).
How can you graph such a scatterplot in R? One approach that you can use is
to generate variables X and Y that follow a bivarate normal distribution. This
can be done with the function mvrnorm(), from the R package "MASS".
The following code allows you to generate a bivariate normal distribution
based on summary statistics for variables X and Y. You need to specify the
univariate means, standard deviations (and variances), as well as the
desired correlation coefficient. Taking into account the provided inputs,
a vectors of means, and a variance-covariance matrix are obtained with
mvrnorm(). And finally a scatterplot is produced with plot():
# MASS package and random seed
library(MASS)
set.seed(20092005)

# summary statistics for x-and-y variables
x_mean <- 170
x_sd <- 40
x_var <- x_sd^2

y_mean <- 70
y_sd <- 30
y_var <- y_sd^2


# covariance based on correlation
xy_cor <- 0.80
xy_cov <- x_sd * y_sd * xy_cor


# multivariate normal distribution
n <- 500
mu <- c(x_mean, y_mean)
Sigma <- matrix(c(x_var, xy_cov, xy_cov, y_var), 2)
hw = mvrnorm(n, mu, Sigma)


# scatter diagram
plot(hw[,1], hw[,2],
     xlim = c(0, 300), ylim = c(-50, 200),
     axes = FALSE, type = 'n',
     xlab = 'height (cms)', ylab = 'weight (kgs)')
axis(side = 1)
axis(side = 2, las = 1)
points(hw[,1], hw[,2], pch = 21, cex = 1.5, col = "white",
       bg = "#555555AA", lwd = 1)