March BARUG Meetup
Posted on March 18, 2014
Yesterday (Saint Patrick’s Day) I attended the March 2014 Meetup of the Bay Area useR Group (BARUG), this time in San Francisco. We had the nice chance to hear three interesting talks that covered a variety of uses, applications, examples, and news from active useRs.
As usual, the meeting was nicely organized by Joseph Rickert (from Revolution Analytics), and this time it was hosted by Predictive Analytics World, who had its march session in San Francisco. By the way, I wish we had more meetings like this in SF, since most of the times they take place in the south bay and that makes the commuting harder for guys like me who are based in Alameda, Contra Costa, and northern counties.
Meetup Agenda
I’ll give you a quick description of last night’s agenda with some personal impressions:
- Predictive Models in R Clustered by Tag Similarity by Max Kuhn
- plyrmr: Hadoop Mapreduce for the rest of us by Antonio Piccolboni
- Statistics, R and Human Rights by Megan Price
An interesting fact of this meetup was that it was first time that we had three repeating speakers. I’m not sure if this is good or bad, or maybe both. I believe there are plenty of speakers out there doing awesome things with R that would be nice to hear about in a BARUG meeting for the first time. But for those of us who cannot attend to all meetings, it’s good to have a second chance to listen to speakers who have previously talked. Their continuous activity around R and their very interesting material makes it always worth being there.
Predictive Models in R Clustered by Tag Similarity
Max Kuhn was the first speaker of the night. He’s the creator of the R package caret, and co-author of a recently published book Applied Predictive Modeling.
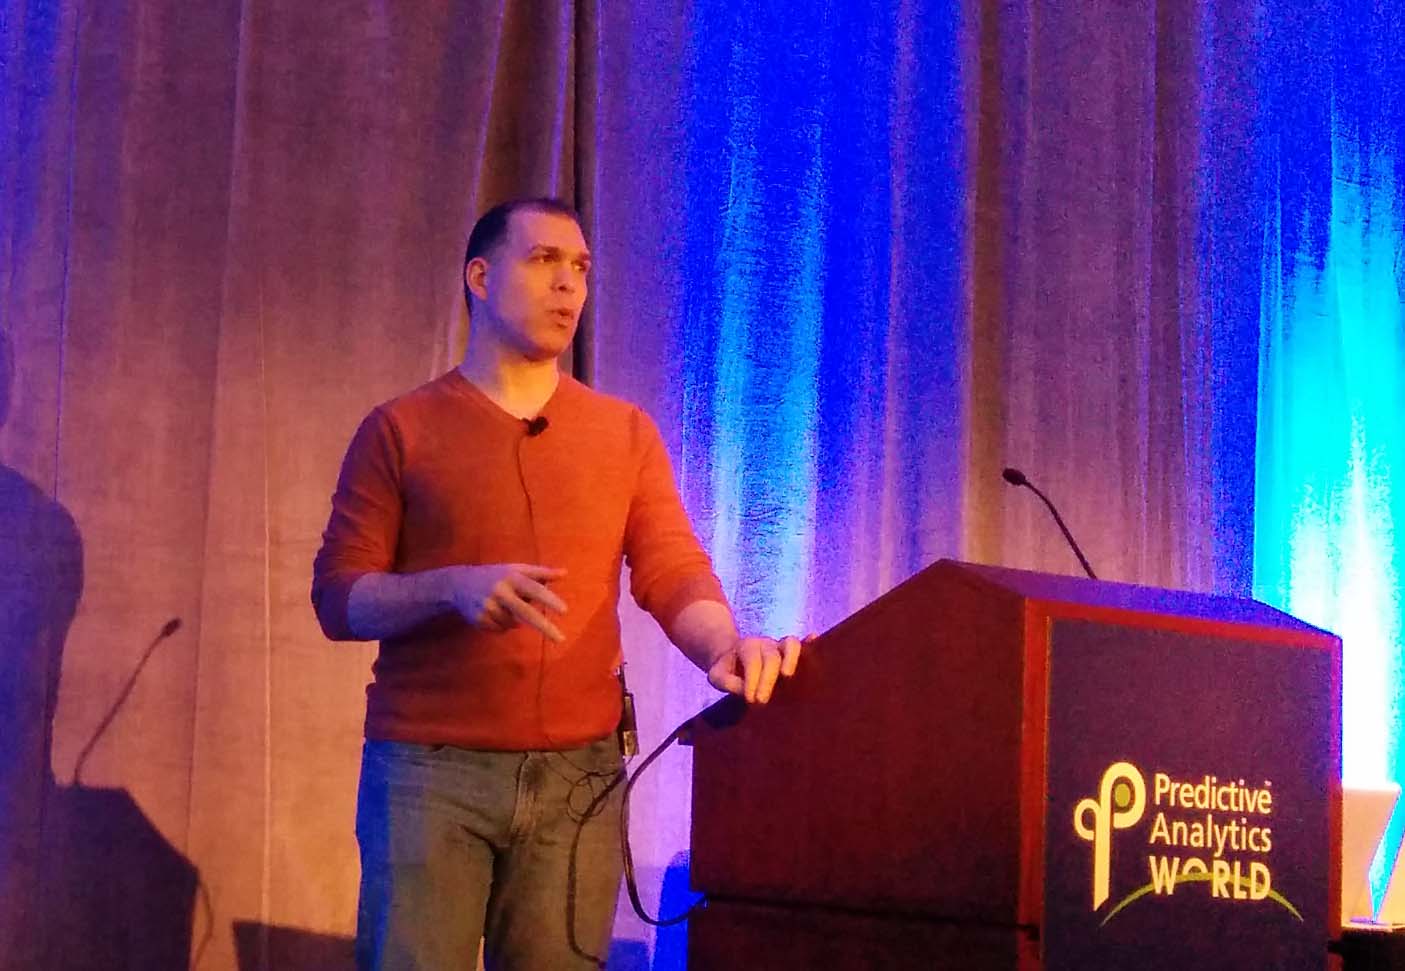
Kuhn’s talk was basically about how to make a network diagram
of all the models that can be accessed by caret’s train function. For those of you who
haven’t heard about caret, this package provides a unified user interface to the wide
range of machine learning models in R.
In order to help users navigate through the ecosystem of machine learning and statistics models, Max has made a catalog by assigning tags to each model (e.g. tags related to model training, prediction, variable importance and so on). You can check this post that contains more detailed information about the resulting network.
plyrmr: Hadoop Mapreduce for the rest of us
The second speaker of the meetup was Antonio Piccolboni. He’s one the lead developers behind the RHadoop project.
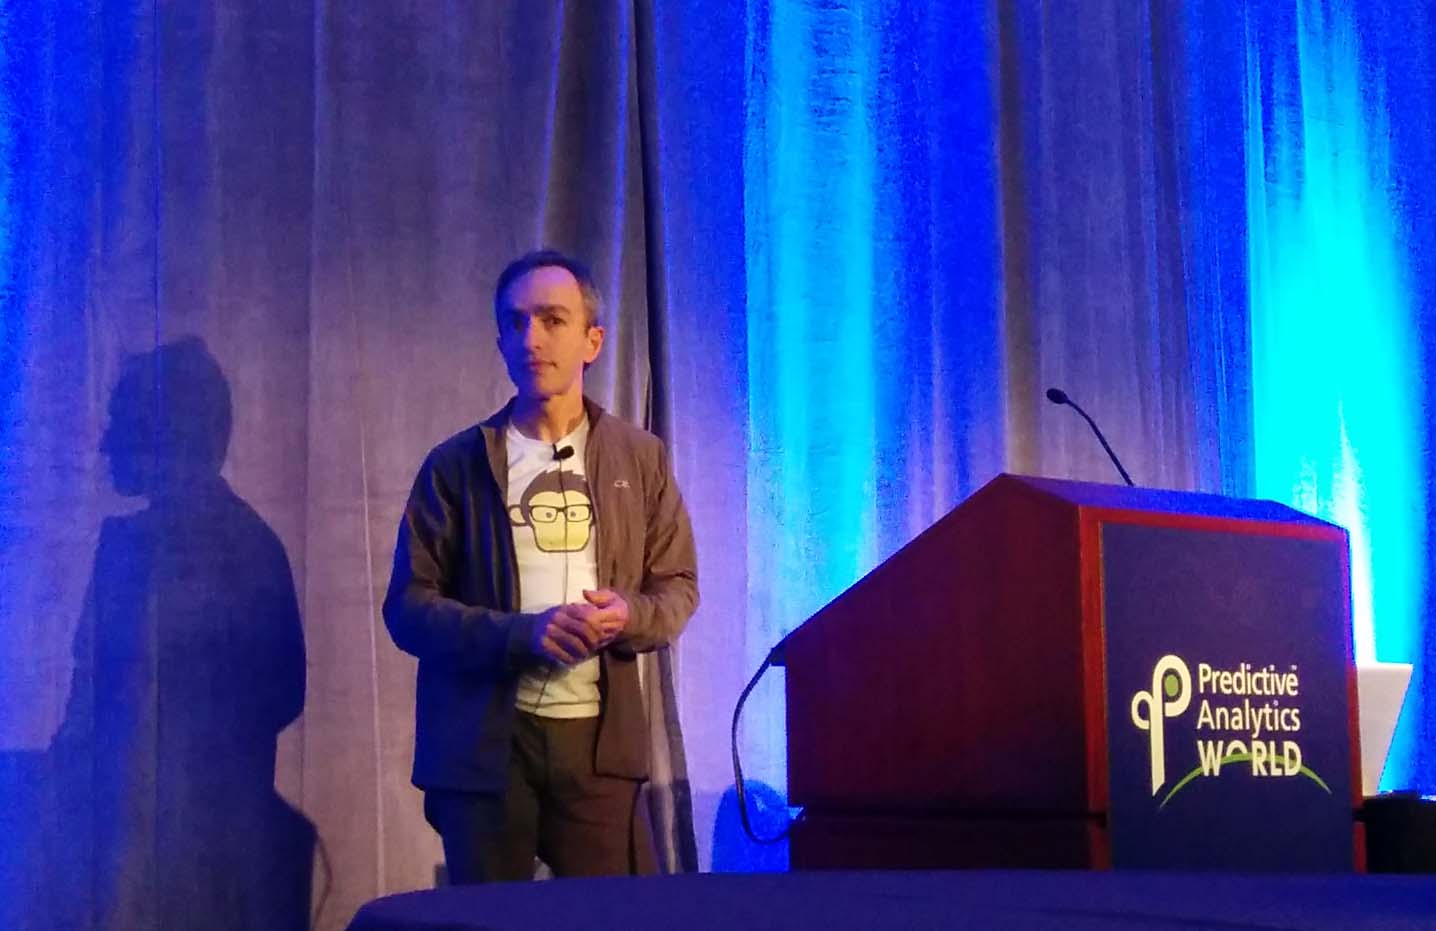
Antonio gave a presentation about the R package plyrmr.
(short for plyr mapreduce). Broadly speaking, this package allows users to perform data
manipulations as found in packages like plyr and reshape2, on very large data sets stored
on Hadoop. The special feature about
plyrmr is that it relies on Hadoop mapreduce to
perform its operations but it hides many of its related intricacies. At the end, what you
have with plyrmr is a familiar plyr-like interface for non Hadoop users. To be
honest, I haven’t tried any of the RHadoop associated packages, but from Antonio’s talk,
now I’m more than curious to check them out and see how they can benefit me.
Statistics, R and Human Rights
The third and last speaker of the meetup was Megan Price. She’s the co-founder and director of research of Human Rights Data Analysis Group (HRDAG). Simply put HRDAG is a non-profit, non-partisan organization that applies rigorous science to the analysis of human rights violations around the world.
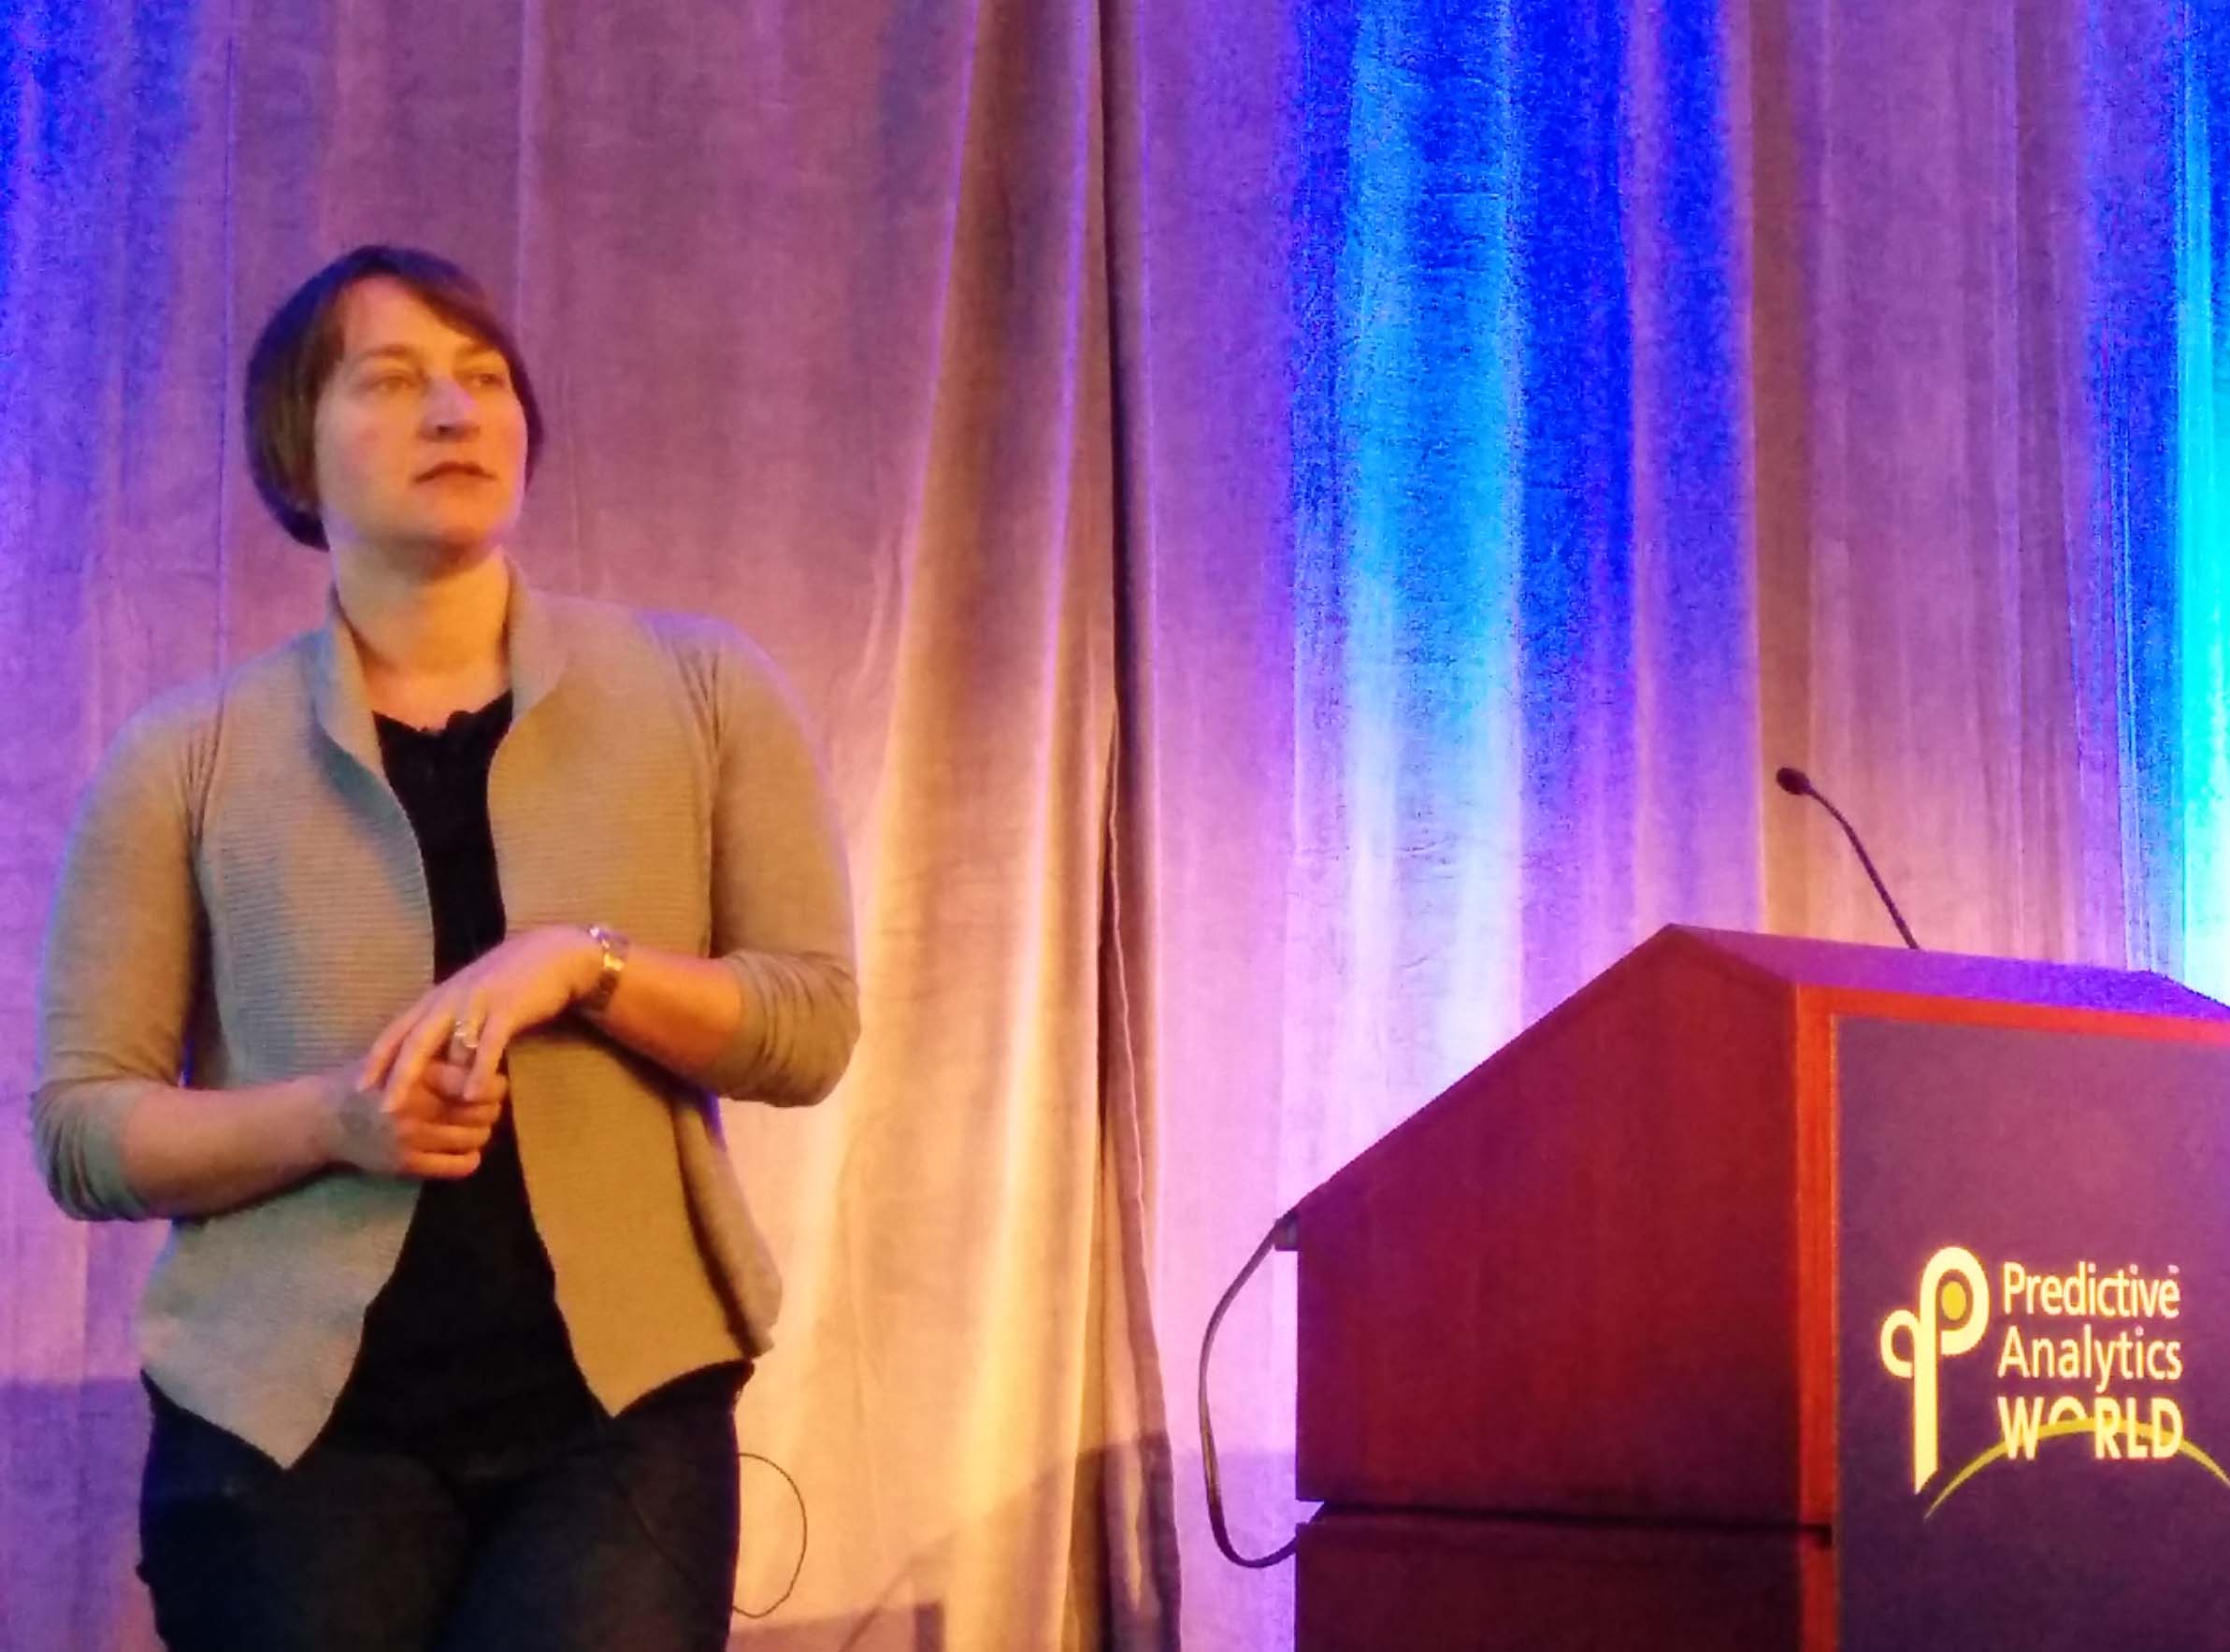
I loved the extremely interesting and captivating title of her talk How a Small Non-Profit Human Rights Group Uses R (see picture below).
Megan talked about the overall analysis pipeline at HRDAG and the role R plays within their workflow. Among the various reasons for choosing and using R over other programs, she highlighted the interoperability that R allows with other elements present in any data analysis project: data sets, reports, documentation.
Generating reports and documents (with the help of Sweave and knitr) allows you to avoid error-prone copy-pastings, while keeping updated your workflow. Since much of the data at HRDAG gets constantly updated with new feeds from their partners, they need to be able re-run the analyses, plots, and summaries. R is great for this type of tasks.
Although Megan didn’t talk about the applied models, nor she showed a case study, she showed us some really cool examples of the non-typical type of data they have to deal with and how they tackle seemingly unanswerable questions like: what is the number of victims in several war conflicts around the world.
If you’re curious about Megan and HRDAG, you can also check this video of her presentation at Strata last february (2014).