About
I first heard of Closeread at the end of August 2024 in one of my meetings with Andrew Bray, when we were preparing for the beginning of the Fall semester and getting ready to teach STAT 20 “Introduction to Probability and Statistics”, at UC Berkeley.
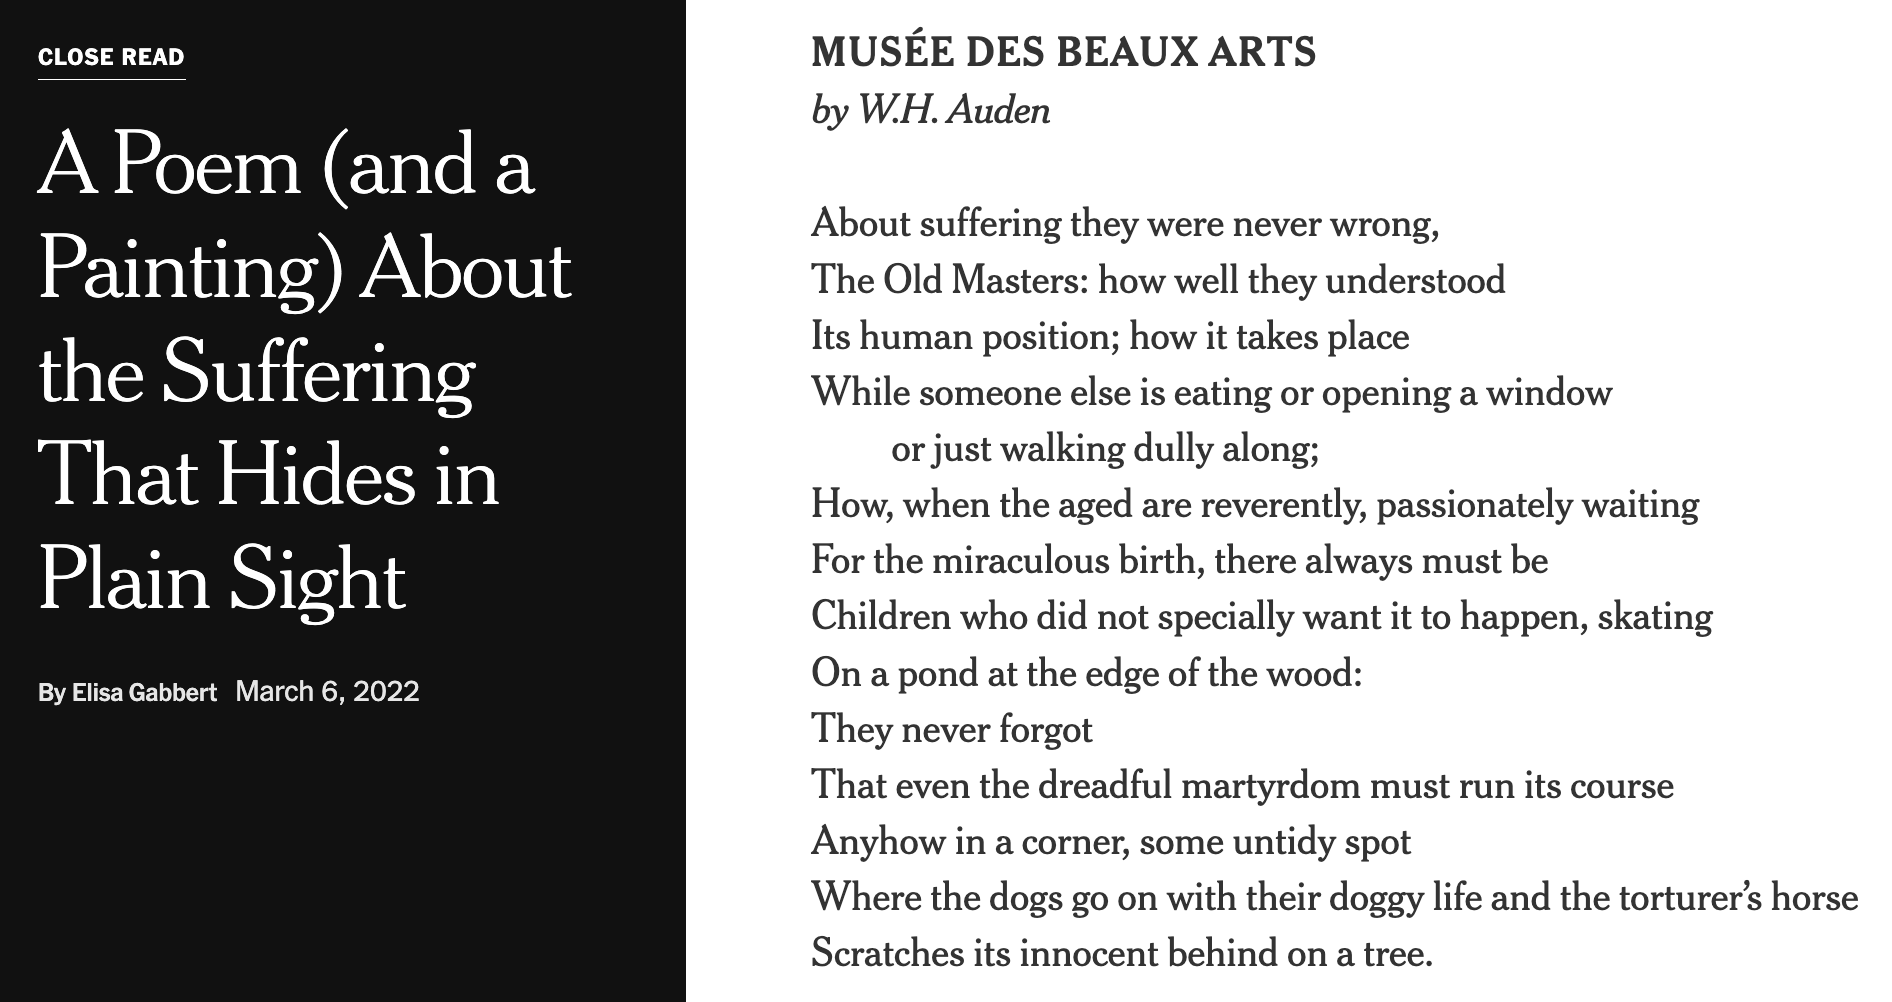
I don’t recall the exact details for how our conversation drifted to a tangential topic related with one of my favorite subjects: Data Visualization. The important thing is that Andrew briefly mentioned this thing called Closeread. He told me it was a quarto extension, but didn’t say much else about it. Instead, he opened a new tab in his browser, typed in some url, and voila, there it was on his big screen mounted on the wall: a live demo of Closeread based on an article from The New York Times (NYT) that had captivated Andrew two years prior which started it all off:
www.nytimes.com/interactive/2022/03/06/books/auden-musee-des-beaux-arts.html
I was not familiar with this particular article from NYT, but I was definitely aware of the scrollytelling feature used in many other NYT articles, especially in those data-journalism articles involving graphics and data visualizations.
I should say I didn’t know the existence of this term: scrollytelling. Andrew didn’t mention it in our meeting. I knew what it looked like, and its visual effect on HTML documents, I just didn’t know there was a word for it.
Fast forward three months later, in the middle of November, I received an email from Andrew in which he was going to give a workshop on Closeread to be held on Wednesday November-20th, at 5pm in one of the classrooms in the 3rd floor of Evans hall.
I was one of 25 or so participants that attended the workshop that evening, and probably one of the few ones who had heard of Closeread and seen it first hand in action already.
I got immediately hooked by Closeread’s simplicity. Yes, there were various technical details, tricky concepts, and of course some jargon involved. But I was sold into this tool right away.
At the beginning of the workshop Andrew asked participants to briefly introduced themselves and to say why they were interested in the workshop. My reason—I told everyone—was to learn about Closeread so that I could teach it in my STAT 133 course (an introductory-to-intermediate level course on data analysis using R, RStudio, Quarto ecosystem, and other computational tools).
My answer was a very honest one, and I truly meant it. But if I wanted to teach Closeread and help spread it out, first I had to learn how to use it. And this is how this website came out to be.
Gaston Sanchez
Berkeley, California
Winter 2024