Arc Diagrams in R: Les Miserables
Posted on February 02, 2013
In this post we will talk about the R package "arcdiagram" for plotting pretty arc
diagrams like the one below:
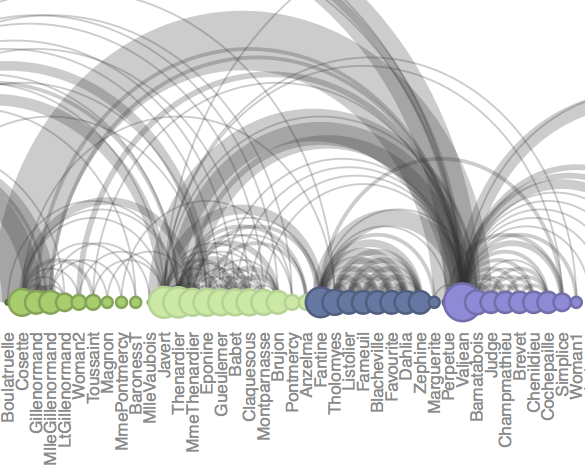
Arc Diagrams
An arc diagram is a graphical display to visualize graphs or networks in a one-dimensional layout. The main idea is to display nodes along a single axis, while representing the edges or connections between nodes with arcs. One of the disadvantages of arc diagrams is that they may not provide the overall structure of the network as effectively as a two-dimensional layout; however, with a good ordering of nodes, better visualizations can be achieved making it easy to identify clusters and bridges. Further, annotations and multivariate data can easily be displayed alongside nodes.
Some inspiration
I got hooked with arc diagrams the first time I saw the famous Similar Diversity graphic by Philipp Steinweber and Andreas Koller. I was so captivated with this diagram that I eventually made my own attempt to replicate it using the Star Wars movie scripts (see this post and these slides).
Arc Diagram: Les Misérables
Another really cool example of an arc diagram can be found in the examples’ gallery of Protovis (by Mike Bostock):

The diagram above is based on a network representation of character co-occurrence in the chapters of Victor Hugo’s classic novel Les Misérables. The original data set is from The Stanford GraphBase: A Platform for Combinatorial Computing (by Donald Knuth). The node colors indicate cluster memberships. You can find related files with the character co-occurrence network in Protovis and Gephi:
- Protovis: miserables.js (json format)
- Gephi: lesmiserables.gml (GML format)
Les Misérables Arc in R
The R package "arcdiagram" has been designed to help you plot pretty arc diagrams
of graphs in R. You can think of it as a plugin of the package "igraph" (by Gabor
Csardi and Tamas Nepusz). However, you could also make it work with "network" (by
Carter Butts et al).
"arcdiagram" lives in one of my
github repositories;
the complete documentation of the package as well as some basic examples are available at:
www.gastonsanchez.com/arcdiagram_introduction.pdf
1) Installation
To install "arcdiagram" you will need to use the function install_github()
from the package "devtools" (by Hadley Wickham):
# install devtools
install.packages("devtools")

# load devtools
library(devtools)

# install arcdiagram
install_github('arcdiagram', username = 'gastonstat')

# load arcdiagram
library(arcdiagram)
2) Download the gml file lesmiserables.txt
After installing "arcdiagram", the next step is to download the data file
lesmiserables.txt that contains the graph in
GML
format. Download lesmiserables.txt
In my case I downloaded the file in my directory: "/Users/gaston/lesmiserables.txt"
(yours will be different). Once you have the graph file, you can import it in R with
the function read.graph() like so:
# location of 'gml' file
mis_file = "/Users/gaston/lesmiserables.txt"

# read 'gml' file
mis_graph = read.graph(mis_file, format = "gml")
3) Extracting graph attributes
The main function in "arcdiagram" is the arcplot() function. This function
requires an edgelist as its primary ingredient (an edge list is just a two column
matrix that gives the list of edges for a graph). The rest of its arguments are a bunch
of graphical parameters to play with.
Most of the information that we need to reproduce the arc diagram is already contained
in the gml file as vertex and edge attributes. The trick is to extract the values with
the functions get.vertex.attribute() and get.edge.attribute():
# get edgelist
edgelist = get.edgelist(mis_graph)

# get vertex labels
vlabels = get.vertex.attribute(mis_graph, "label")

# get vertex groups
vgroups = get.vertex.attribute(mis_graph, "group")

# get vertex fill color
vfill = get.vertex.attribute(mis_graph, "fill")

# get vertex border color
vborders = get.vertex.attribute(mis_graph, "border")

# get vertex degree
degrees = degree(mis_graph)

# get edges value
values = get.edge.attribute(mis_graph, "value")
4) Nodes ordering
We need to get the nodes ordering by using the package "reshape" (by Hadley
Wickham). The idea is to create a data frame with the following variables:
vgroups, degrees, vlabels, and a numeric index ind for the nodes.
We will arrange the data frame in descending order, first by vgroups and then by
degrees; what we want is the sorted numeric index ind:
# load reshape
library(reshape)

# data frame with vgroups, degree, vlabels and ind
x = data.frame(vgroups, degrees, vlabels, ind = 1:vcount(mis_graph))

# arranging by vgroups and degrees
y = arrange(x, desc(vgroups), desc(degrees))

# get ordering 'ind'
new_ord = y$ind
5) Plot arc diagram
Now that we have all the elements for arcplot() (edgelist, nodes ordering,
graphical attributes), we are ready to plot the arc diagram. Here’s the code in R:
# plot arc diagram
arcplot(edgelist, ordering = new_ord, labels = vlabels, cex.labels = 0.8,
        show.nodes = TRUE, col.nodes = vborders, bg.nodes = vfill,
        cex.nodes = log(degrees) + 0.5, pch.nodes = 21, lwd.nodes = 2, line = -0.5,
        col.arcs = hsv(0, 0, 0.2, 0.25), lwd.arcs = 1.5 * values)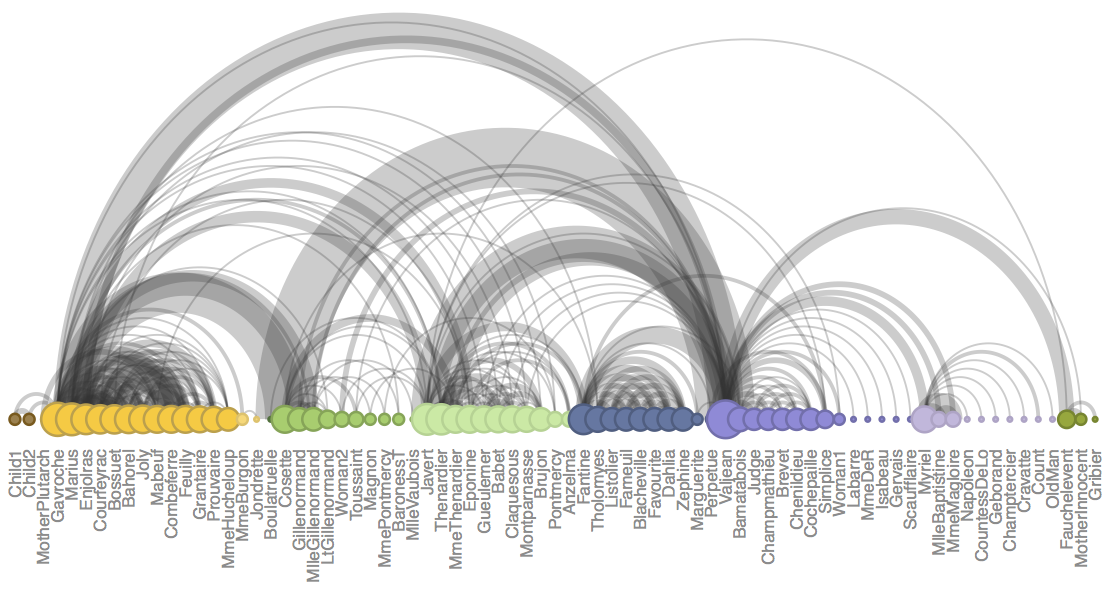
Happy plotting!