Graphs from Dendrograms
Posted on June 29, 2014
R has various functions (and packages) for working with both hierarchical clustering dendrograms and graphs. The problem is that there’s almost no information on how convert a dendrogram into a graph.
Trees and Graphs
For one of my visualization projects I was faced with the following question: How to obtain a graph structure from a dendrogram structure? As simple as this question may seem, it took me a couple of days to find out a satisfactory answer.
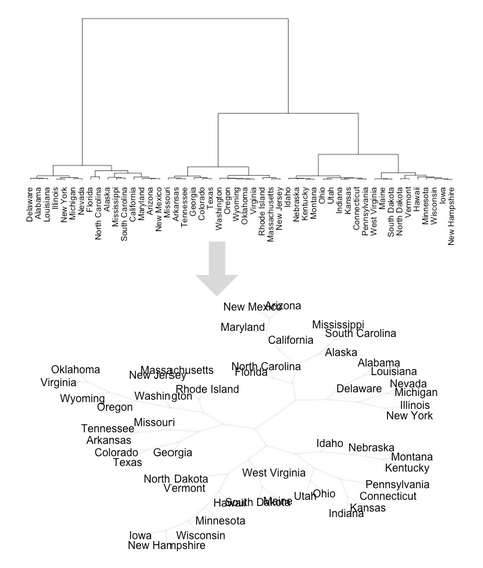
Recall that a dendrogram is a just tree diagram used to display the arrangement of the clusters produced by hierarchical clustering. Interestingly, we can think of a dendrogram as a graph with a tree structure. The leafs of the dendrogram and the merged nodes can be seen as the graph nodes. In turn, the branches of the dendrogram can be regarded as the graph edges.
Hierarchical Clustering Dendrogram
Let’s start by generating a hierarchical clustering with hclust(). We’ll
use the data USArrests for demo purposes:
# distance matrix
dist_usarrests = dist(USArrests)

# hierarchical clustering analysis
clus_usarrests = hclust(dist_usarrests, method = "ward.D")

# plot dendrogram
plot(clus_usarrests, hang = -1)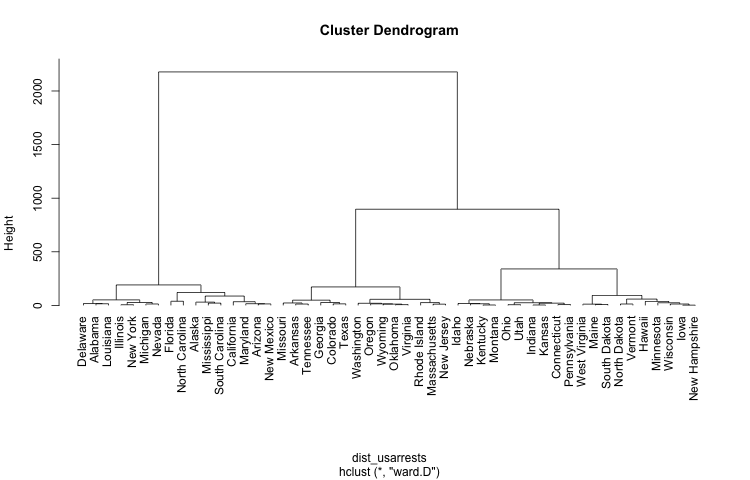
Although "hclust" provides information about the merged nodes, it doesn’t provide
all the necessary elements to build a graph. To do this, we need to use
the function as.phylo() from the R package "ape". The good news
about a "phylo" object is that it contains all the tree edges needed
to build a graph.
# library ape
library(ape)

# convert 'hclust' to 'phylo' object
phylo_tree = as.phylo(clus_usarrests)

# get edges
graph_edges = phylo_tree$edge
Graph
Once we have the edges we can build a graph using the function graph.edgelist()
from the package "igraph".
# library igraph
library(igraph)

# get graph from edge list
graph_net = graph.edgelist(graph_edges)

# plot graph
plot(graph_net)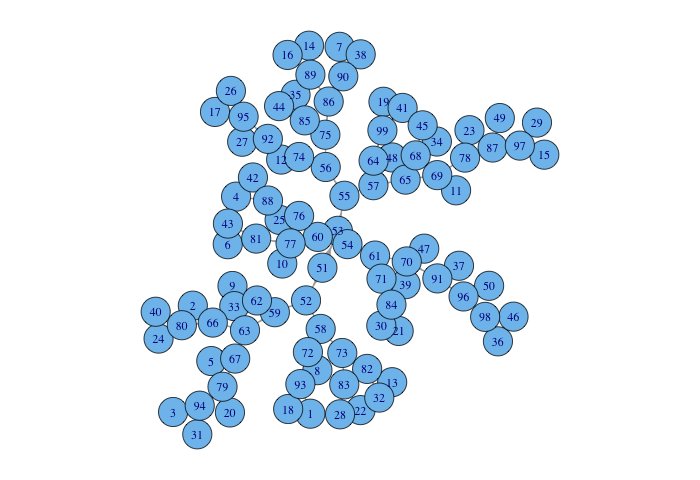
The previous plot is kind of messy but the graph has exactly what we want: it has all the leafs, nodes and edges from the dendrogram.
Finally, we can play with the different graph layouts to get a set of x-y
coordinates. For instance, we can use the layout.auto() function to get
nodes nicely spread. Having the layout coordinates we can plot a graph with
a tree structure using some R plotting tools:
# extract layout (x-y coords)
graph_layout = layout.auto(graph_net)

# number of observations
nobs = nrow(USArrests)

# start plot
plot(graph_layout[,1], graph_layout[,2], type = "n", axes = FALSE,
     xlab = "", ylab = "")
# draw tree branches
segments(
  x0 = graph_layout[graph_edges[,1],1],
  y0 = graph_layout[graph_edges[,1],2],
  x1 = graph_layout[graph_edges[,2],1],
  y1 = graph_layout[graph_edges[,2],2],
  col = "#dcdcdc55", lwd = 3.5
)
# add labels
text(graph_layout[1:nobs,1], graph_layout[1:nobs,2],
     phylo_tree$tip.label, cex = 1, xpd = TRUE, font = 1)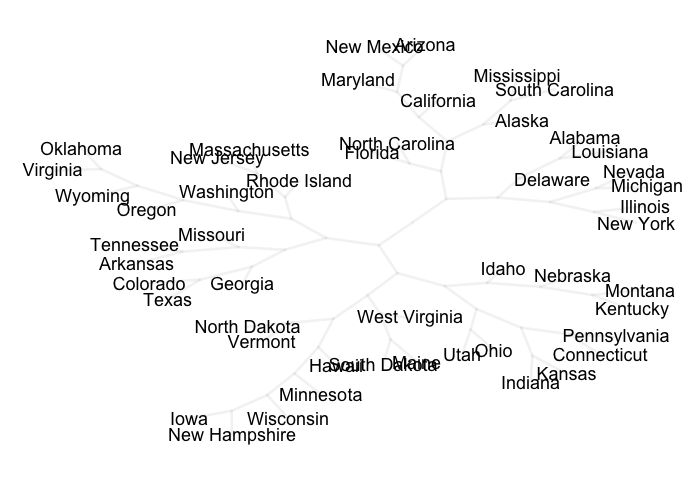
If you’re interested in getting a pretty tree graph check the next post.