Shiny Apps for Introductory Statistics
Posted on February 16, 2016
Sharing the shiny apps for my “STAT 2: Introduction to Statistics” course at UC Berkeley.
Introduction
This Spring (2016) I’m lecturing Stat 2: Introduction to Statistics at UC Berkeley. This is one of the introductory courses for Statistics (e.g. Stat 2, Stat 20, and Stat 21) offered by the Stats Department. Besides sharing the materials of the course, available at gastonsanchez.com/stat2, I’ve also decided to share the shiny apps that I’ve created for some of my lectures.
About Stat 2
The Stat 2 course focuses on univariate descriptive statistics, emphasizing critical thinking and clear communication. For many students, especially those enrolled in non-quantitative majors, this course is the only formal training they will receive in college (and pretty much in their lives). The learning objectives are:
- The fundamental concepts and methods of statistics
- How to intepret graphical and numerical summaries of data
- Understand the reasoning behind the calculations, the assumptions under which they are valid, and the correct interpretation of results
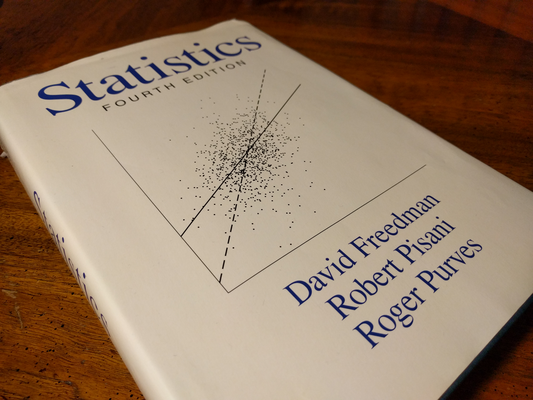
Together with Stat 20, and Stat 21, these courses are based on the mythic text book Statistics written by David Freedman, Robert Pisani, and Roger Purves, aka “FPP”.

Motivation
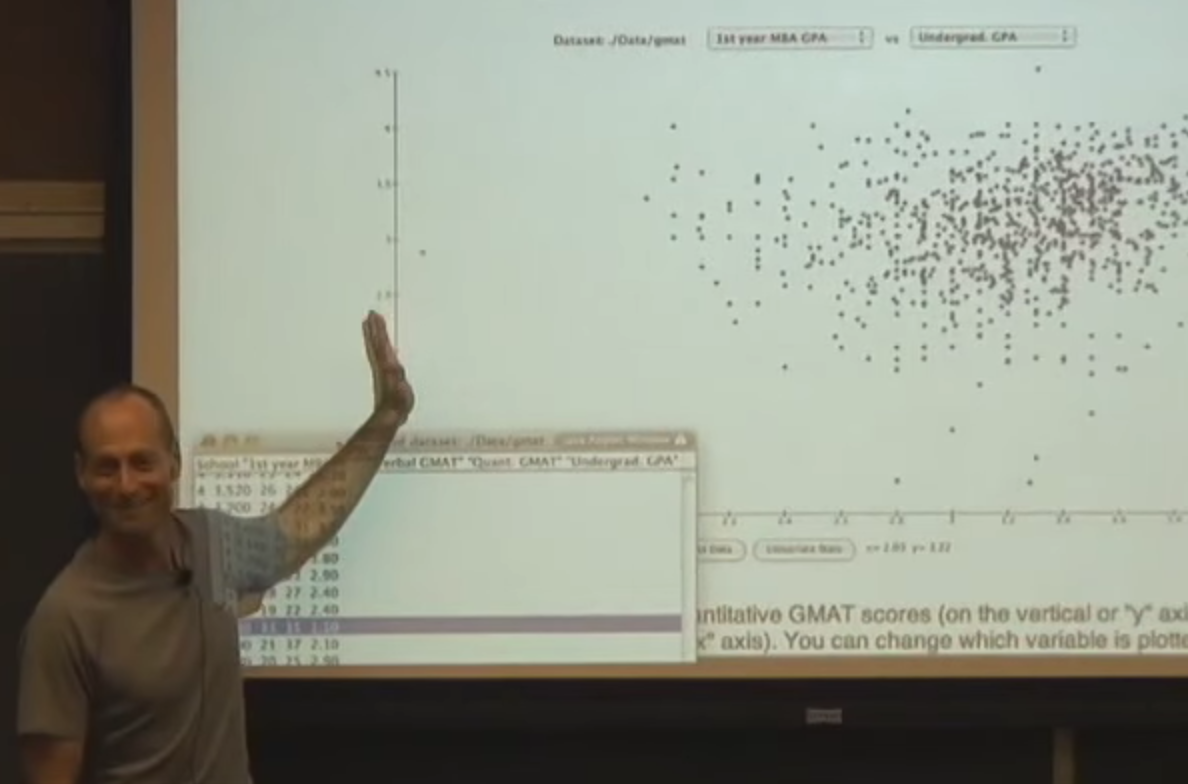
I took the idea to use interactive graphics from the material created by Philip Stark. As part of his teaching material for the basic stats courses, Philip developed SticiGui which is an online text that is supposed to contain dozens of interactive tools. Nowadays, if you check the book’s content, the applets no longer work, but you can check some videos on youtube where Philip is teaching Stat 21 using his interactive tools (see screenshot below).

Inspired by Philip’s work, I decided to write a series of shiny apps and make them available on a github repository: shiny-introstats. Although I’m creating these apps for my course, my secondary aim is that they can be used by other instructors not only in Cal’s Stats Department, but in any other institution.
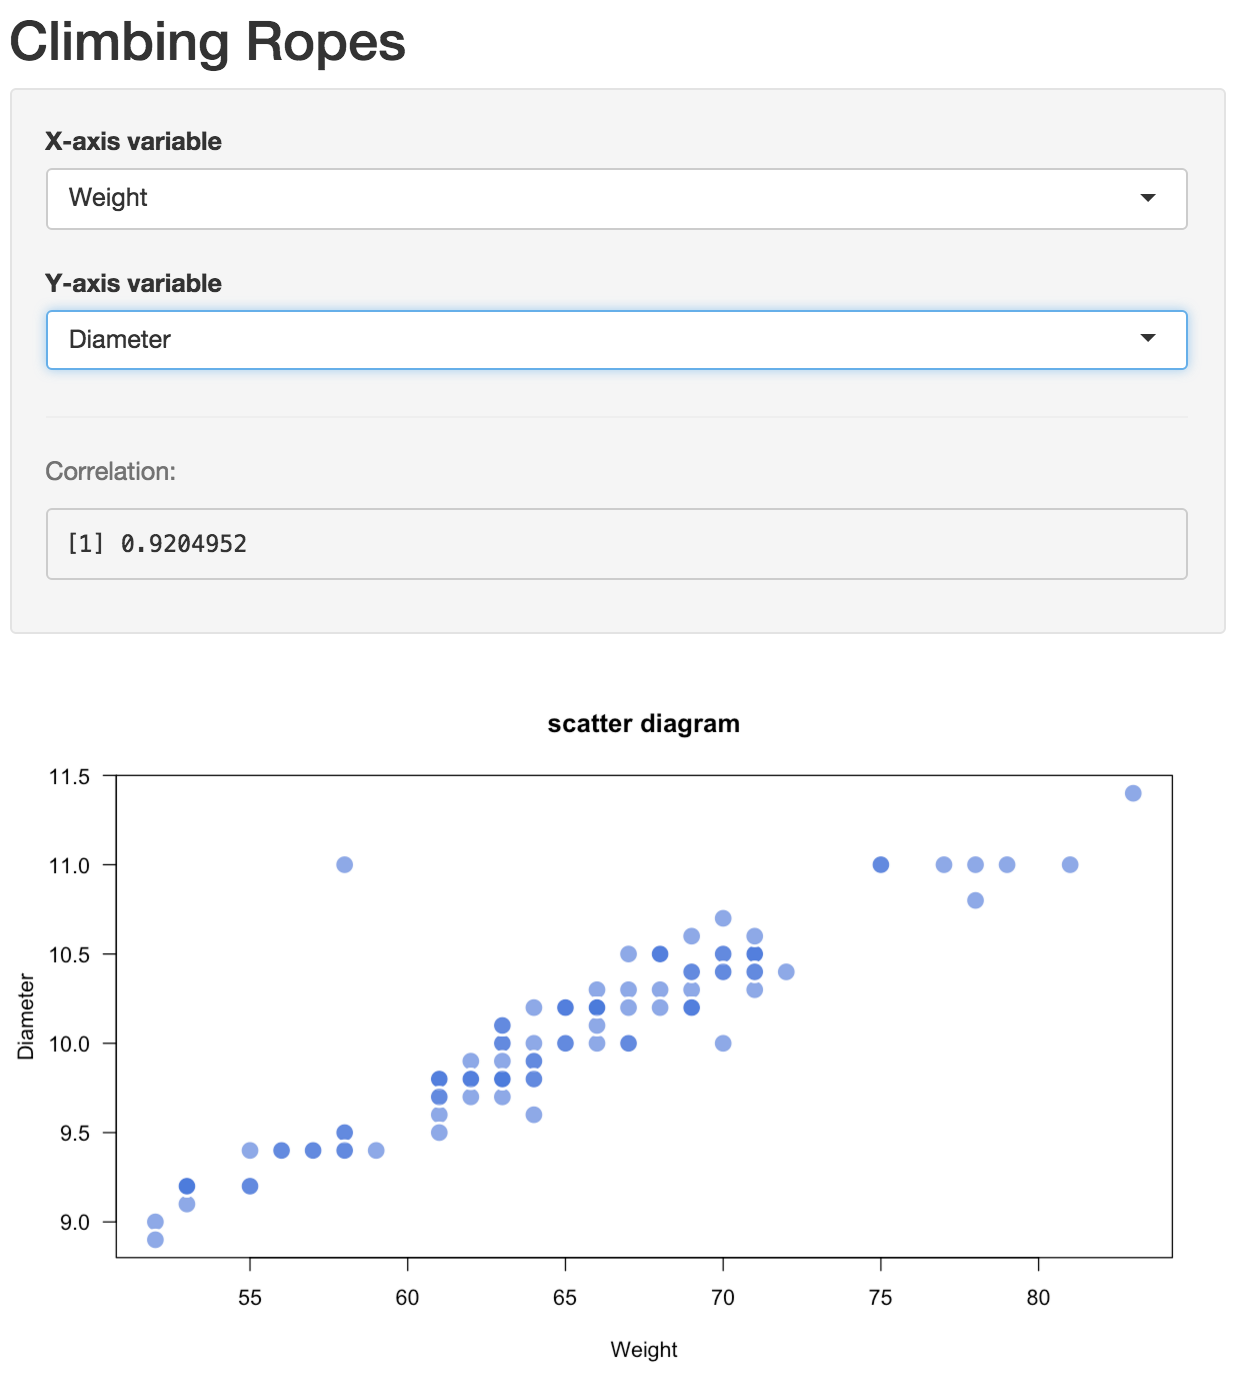
Here’s a screenshot of one of the apps illustrating scatterplots and types of correlations.
