We’ve been working with the table storms75, which was obtained by filtering those rows with year equal to 1975:
storms75 <-filter(storms, year ==1975)storms75
# A tibble: 238 × 13
   name   year month   day  hour   lat  long status      category  wind pressure
   <chr> <dbl> <dbl> <int> <dbl> <dbl> <dbl> <fct>          <dbl> <int>    <int>
 1 Amy    1975     6    27     0  27.5 -79   tropical d…       NA    25     1013
 2 Amy    1975     6    27     6  28.5 -79   tropical d…       NA    25     1013
 3 Amy    1975     6    27    12  29.5 -79   tropical d…       NA    25     1013
 4 Amy    1975     6    27    18  30.5 -79   tropical d…       NA    25     1013
 5 Amy    1975     6    28     0  31.5 -78.8 tropical d…       NA    25     1012
 6 Amy    1975     6    28     6  32.4 -78.7 tropical d…       NA    25     1012
 7 Amy    1975     6    28    12  33.3 -78   tropical d…       NA    25     1011
 8 Amy    1975     6    28    18  34   -77   tropical d…       NA    30     1006
 9 Amy    1975     6    29     0  34.4 -75.8 tropical s…       NA    35     1004
10 Amy    1975     6    29     6  34   -74.8 tropical s…       NA    40     1002
# ℹ 228 more rows
# ℹ 2 more variables: tropicalstorm_force_diameter <int>,
#   hurricane_force_diameter <int>
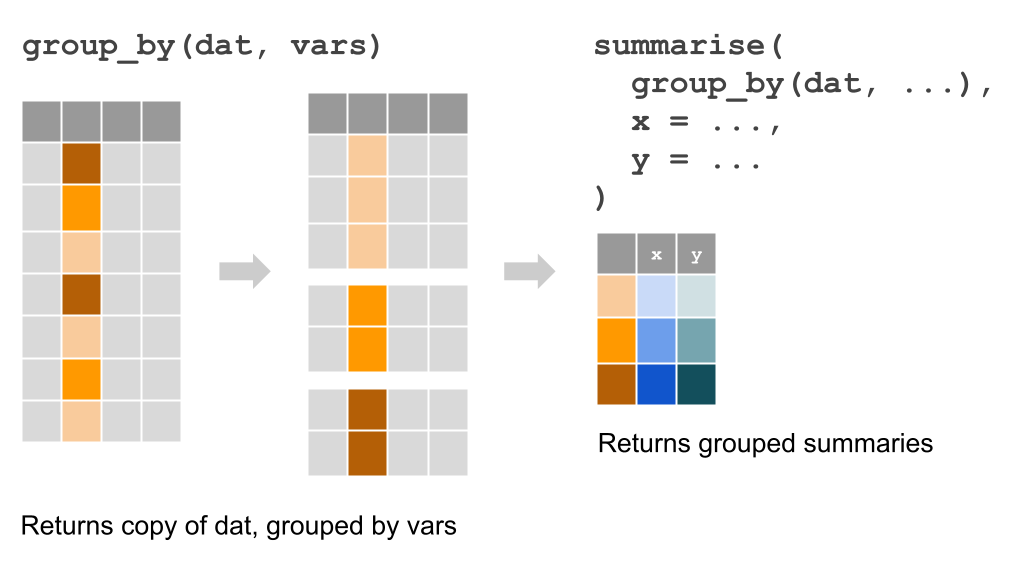
10.1 Group-by Operations
Another common task when exploring data has to do with computations applied on certain groups or categories of data. "dplyr" provides the function group_by() which takes a data table, and we specify the column(s) on which rows will be grouped by:
Group-by operations
For example, we may be interested in calculating the average wind speed and average pressure of each storm in 1975. First we need to group by name, and then we use summarise() to indicate that we want to get the mean() of wind and pressure, like this:
The table of summary means avg_wind_pressure_75 is ordered alphabetically by name. But perhaps you may want to organize its contents by avg_wind or by avg_pressure. Let’s see how to do this.
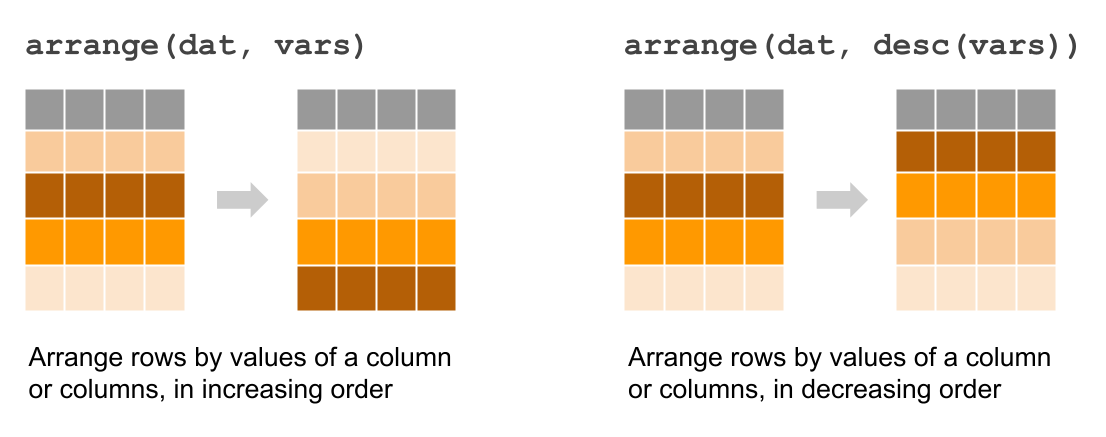
Besides group_by() operations, another common type of manipulation is the arragement of rows based on the values of one or more columns. In "dplyr", this can easily be achieved with the function arrange(). The way this function works is passing the name of the table, and then specifying one or more columns to order rows based on such values.
Arranging rows
Say you want to arrange the contents of the average summary table, by taking into account the column avg_wind:
The default behavior of arrange() is to organize rows in increasing order. But what if you want to organize rows in decreasing order? No problem, just use the auxiliary function desc() to indicate that rows should be arranged decreasingly:
Let’s focus on a specific storm, for example storm Amy in 1975. For sake of simplicity, we are going to create a table amy75 containing the values of this storm:
amy75 <-filter(storms75, name =="Amy")amy75
# A tibble: 31 × 13
   name   year month   day  hour   lat  long status      category  wind pressure
   <chr> <dbl> <dbl> <int> <dbl> <dbl> <dbl> <fct>          <dbl> <int>    <int>
 1 Amy    1975     6    27     0  27.5 -79   tropical d…       NA    25     1013
 2 Amy    1975     6    27     6  28.5 -79   tropical d…       NA    25     1013
 3 Amy    1975     6    27    12  29.5 -79   tropical d…       NA    25     1013
 4 Amy    1975     6    27    18  30.5 -79   tropical d…       NA    25     1013
 5 Amy    1975     6    28     0  31.5 -78.8 tropical d…       NA    25     1012
 6 Amy    1975     6    28     6  32.4 -78.7 tropical d…       NA    25     1012
 7 Amy    1975     6    28    12  33.3 -78   tropical d…       NA    25     1011
 8 Amy    1975     6    28    18  34   -77   tropical d…       NA    30     1006
 9 Amy    1975     6    29     0  34.4 -75.8 tropical s…       NA    35     1004
10 Amy    1975     6    29     6  34   -74.8 tropical s…       NA    40     1002
# ℹ 21 more rows
# ℹ 2 more variables: tropicalstorm_force_diameter <int>,
#   hurricane_force_diameter <int>
Here’s a couple of questions that we could investigate:
which are the status categories for Amy?
during which months was Amy active? and for how many days?
what are the basic summary statistics for wind and pressure?
# which are the `status` categories for Amy?distinct(amy75, status)
# A tibble: 3 × 1
  status
  <fct>
1 tropical depression
2 tropical storm
3 extratropical
# during which months was Amy active?distinct(amy75, month)
# A tibble: 2 × 1
  month
  <dbl>
1     6
2     7
# for how many days was Amy active?count(distinct(amy75, day))
# A tibble: 1 × 1
      n
  <int>
1     8
# summary statistics for windsummary(select(amy75, wind))
      wind
 Min.   :25.00
 1st Qu.:32.50
 Median :50.00
 Mean   :46.45
 3rd Qu.:60.00
 Max.   :60.00
# summary statistics for pressuresummary(select(amy75, pressure))
    pressure
 Min.   : 981.0
 1st Qu.: 986.0
 Median : 987.0
 Mean   : 995.1
 3rd Qu.:1005.0
 Max.   :1013.0
10.4 Exercises
1) Create a table (e.g. tibble) storms_count_75 by filter()-ing storms in year 1975, and count()-ing their names. This table will give the counts (i.e. number of entries) of each storm in 1975.
2) Create a table (e.g. tibble) storms_count_70s by filter()-ing storms in years 1975 to 1979, count()-ing by year and name, and then doing a second count() just by year. This table will give the number of storms in each year frmo 175 to 1979.
3) Use "dplyr" functions/commands to create a table (e.g. tibble) max_wind_pressure_75 of storms in 1975 containing columns: 1) name of storm, 2) max_wind maximum wind speed, and 3) max_pressure maximum pressure.
4) Use "dplyr" functions/commands to create a table (e.g. tibble) wind_stats_75 of storms in 1975 containing columns: 1) name of storm, 2) min_wind minimum wind speed, 3) avg_wind mean wind speed, 4) med_wind median wind speed, and 5) max_wind maximum wind speed.