library(tidyverse) # syntactic data wrangling
library(tmap) # thematic maps
library(sf) # simple features
library(rnaturalearth) # public domain map data sets20 Thematic Maps
So far we’ve seen how to create maps with three approaches:
"maps"and"ggplot2""rnaturalearth","sf", and"ggplot2""leaflet"
In this chapter we describe a third approach to make maps with R packages "sf" and "tmap" (no "ggplot2"). This is yet another map-making approach that is similar to those listed above. One of the main differences is that thematic maps don’t rely on "ggplot2", instead "tmap" relies on its own grammar of graphics.
The code in this chapter requires the following packages:
20.1 Basic World Map
# World map (from "tmap")
data("World")

tm_shape(World) +
  tm_polygons()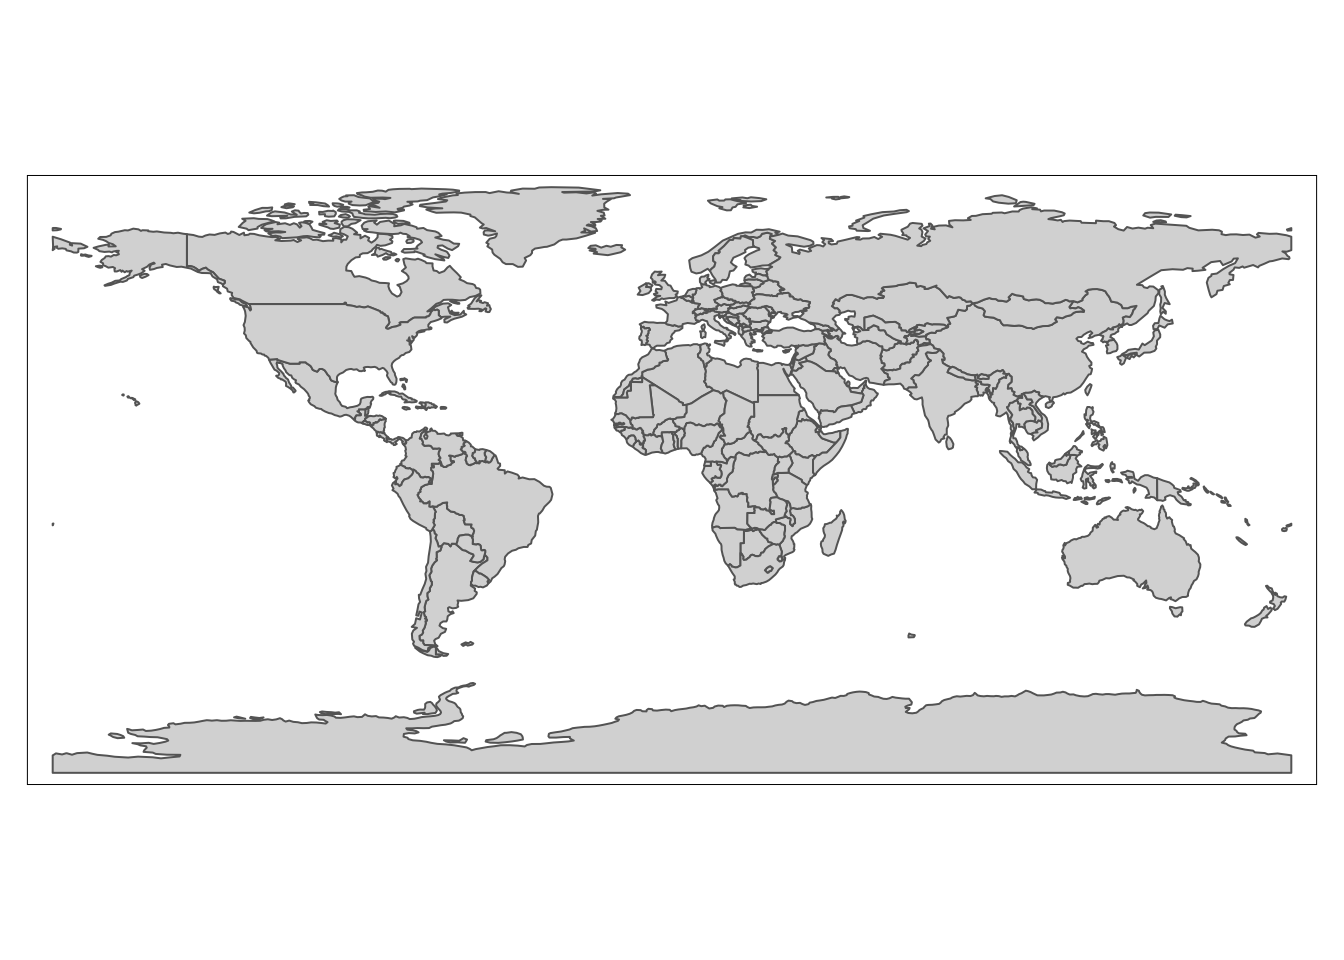
tm_layout() is used to specify elements that have to do with the map layout such as the background color, for example:
tm_shape(World) +
  tm_polygons(col = "gray90") +
  tm_layout(bg.color = "lightblue1")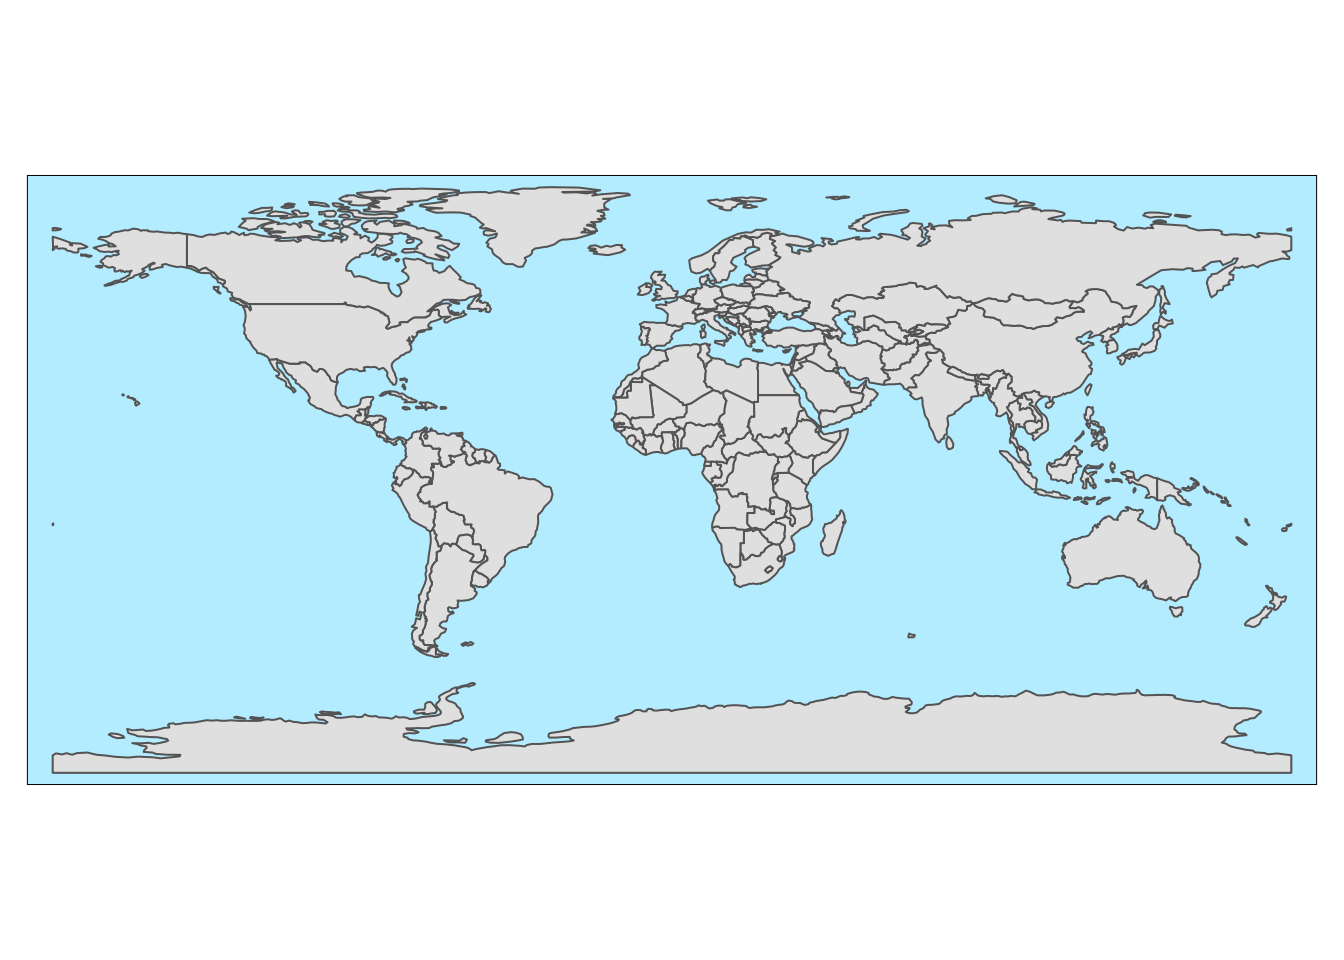
20.1.1 tmaps with sf objects
We can also work with map objects of class "sf" (simple features), which means we can take advantage of maps available in "rnaturalearth"
# natural earth world country polygons
north_america = ne_countries(continent = "north america", returnclass = "sf")

tm_shape(north_america) +
  tm_borders()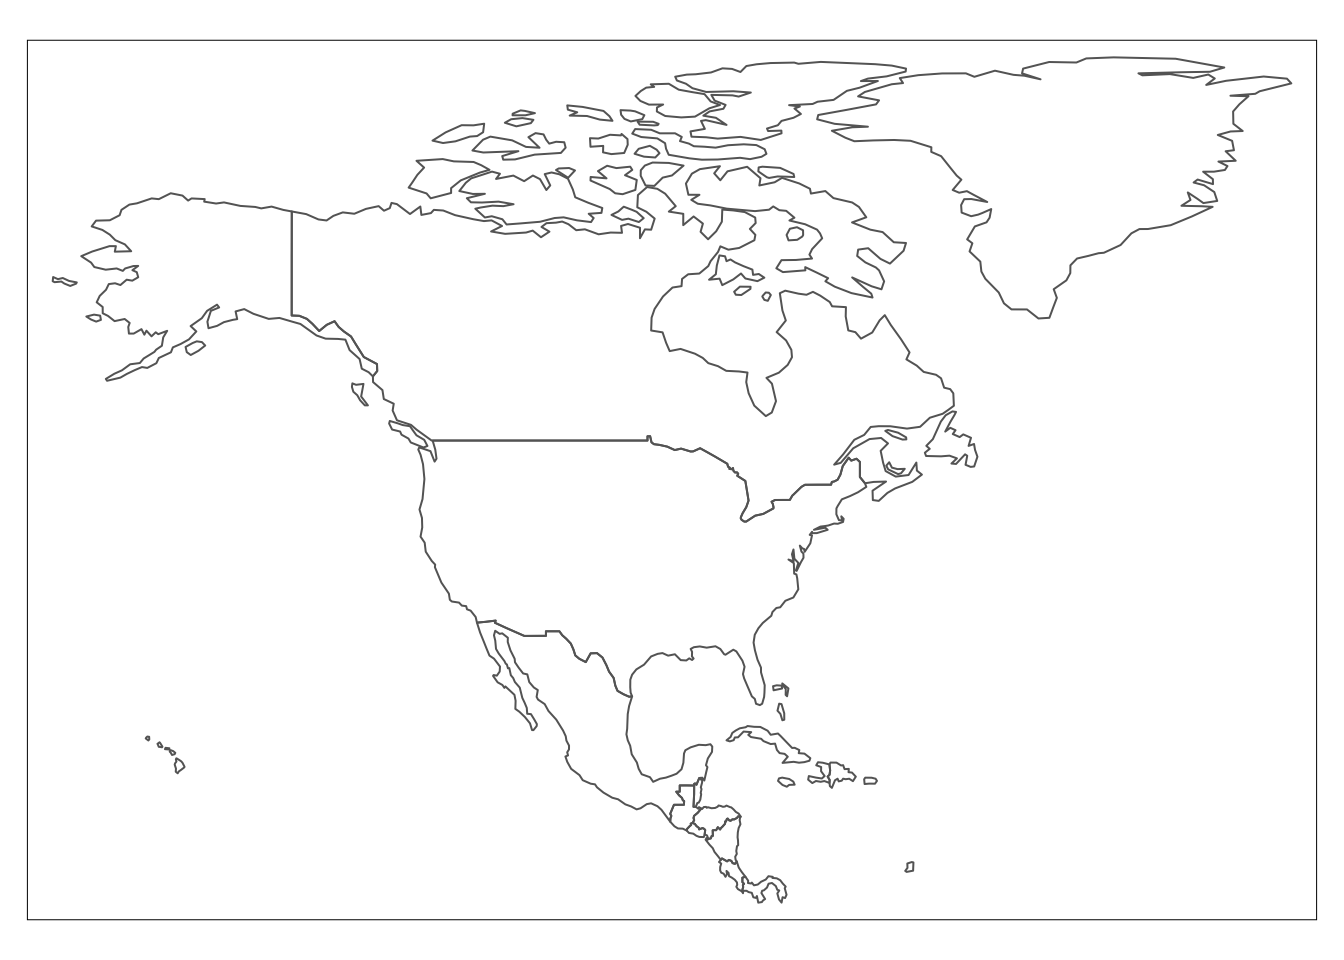
tm_shape(north_america) +
  tm_polygons()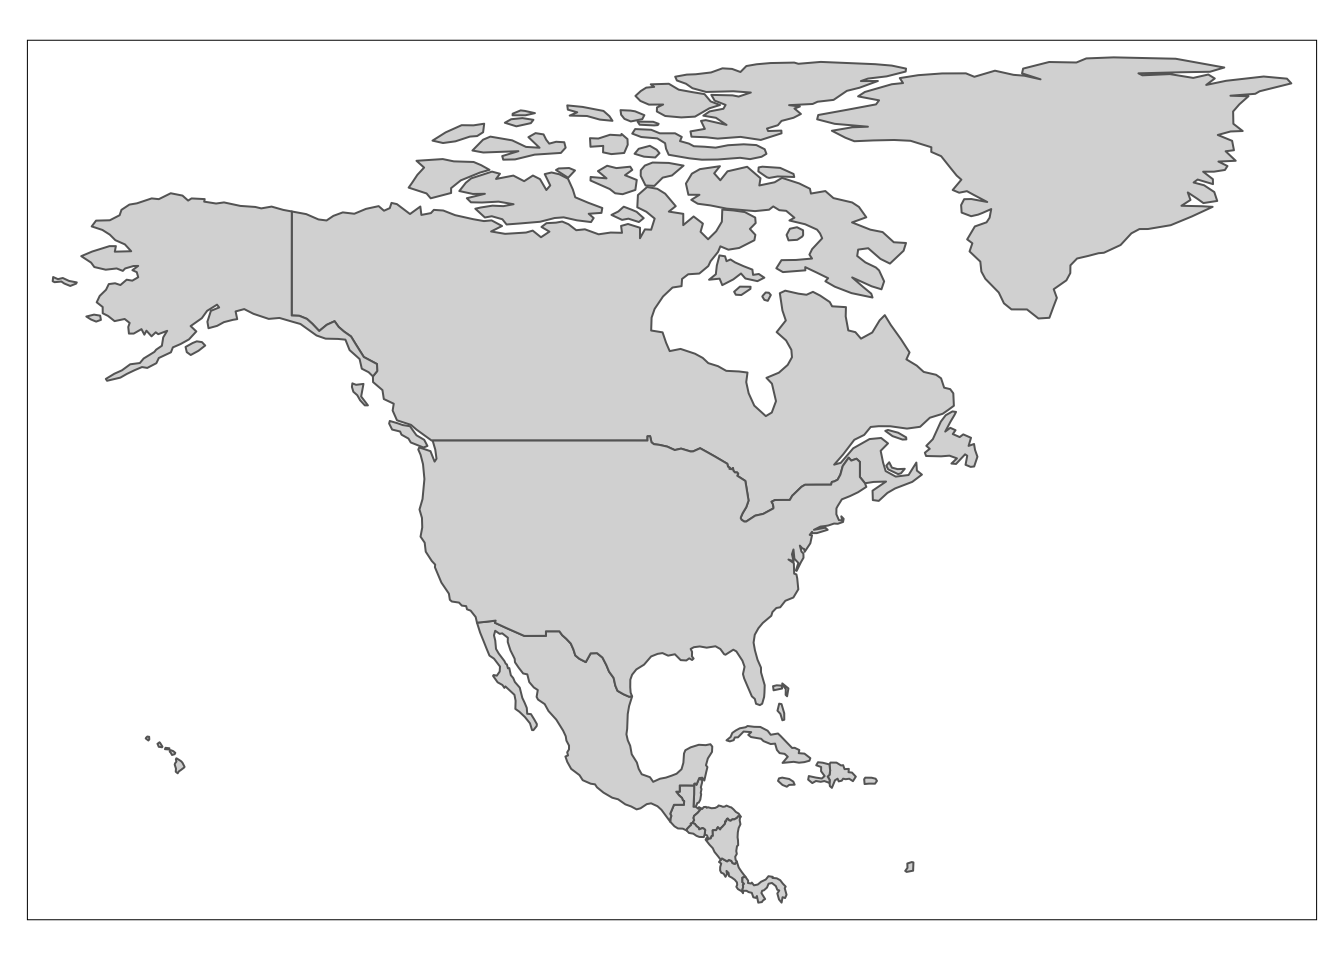
20.2 Adding Storms in 2010
# 2nd map (coloring storms individually)
which_year = 2010

# Subset storms (for a given year)
storms_set = storms |>
  filter(year == which_year)

# convert to "sf" object
storms_set_sf = st_as_sf(storms_set, coords = c("long", "lat"))
Now we can plot it:
tm_shape(north_america) +
  tm_polygons(col = "gray95") +
  tm_shape(storms_set_sf) +
  tm_dots(col = "name", size = 0.1)
Warning: Currect projection of shape storms_set_sf unknown. Long-lat (WGS84) is
assumed.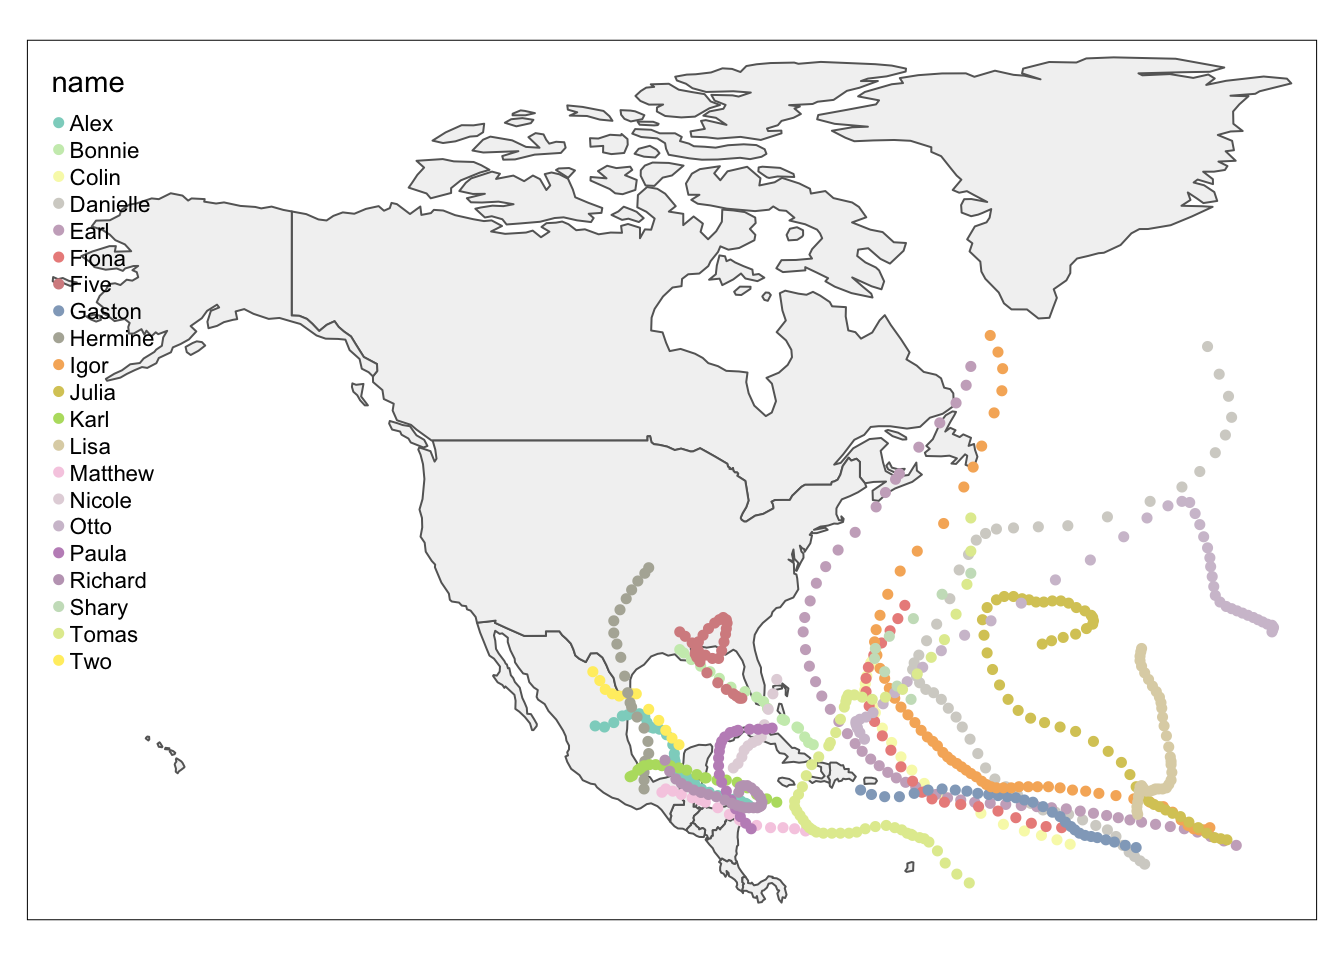
20.3 Adding Hurricanes in 2010
Coordinate Reference Systems (CRS) provide a standardized way of describing locations. Many different CRS are used to describe geographic data. In R, when data with different CRS are combined it is important to transform them to a common CRS so they align with one another.
A particular CRS can be referenced by its EPSG code (e.g. EPSG: 4326).
In order to use the longitude and latitude coordinates of storms with tmap functions, we have to create a simple features object, and also specify the CRS to be used. In this case, we use the standard EPSG: 4326.
The Latitude and Longitude coordinates for a particular location will differ depending on the CRS and when the measurement was taken. Below we use WGS84 (EPSG: 4326)
# 2nd map (coloring storms individually)
which_year = 2010

# Subset storms (for a given year)
hurricanes_set = storms |>
  filter(year == which_year & wind >= 64)

# convert to "sf" object
hurricanes_set_sf = st_as_sf(
  hurricanes_set,
  coords = c("long", "lat"),
  crs = 4326)
Now we can plot it:
tm_shape(north_america) +
  tm_polygons(col = "gray95") +
  tm_shape(hurricanes_set_sf) +
  tm_dots(col = "name", size = 0.2)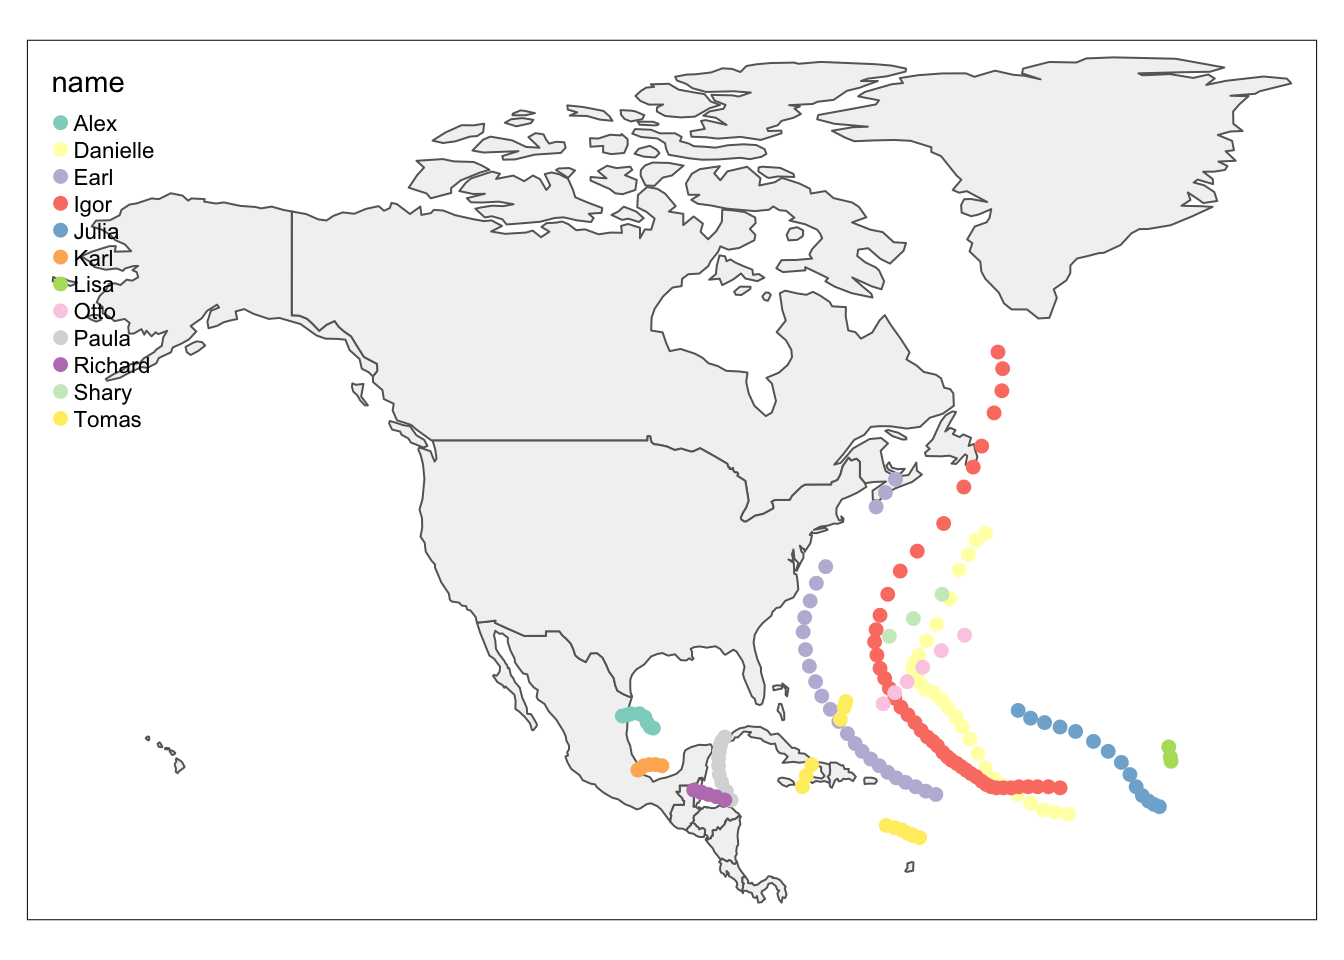
20.4 Interactive Map
tmap_mode("view")tmap mode set to interactive viewingtm_shape(north_america) +
tm_borders() +
tm_shape(hurricanes_set_sf) +
tm_dots(col = "name")