28 Good Coding Practices
Now that you’ve worked with various R scripts, written some functions, and done some data manipulation, it’s time to look at some good coding practices.
Popular style guides among useR’s
28.1 Syntax Highlighting
Nowadays most text editors and IDE (e.g. RStudio) come with syntax highlighting features which make writing and reading code easier. However, it is still possible to find yourself in a situation where the editor you are using has no syntax highlighting. Let’s quickly compare the difference between a few lines of code with and without syntax highlighting:
without:
# without syntax highlighting
a <- 2
x <- 3
y <- log(sqrt(x))
3*x^7 - pi * x / (y - a)
"some strings"
dat <- read.table(file = 'data.csv', header = TRUE)
versus with:
a <- 2
x <- 3
y <- log(sqrt(x))
3*x^7 - pi * x / (y - a)
"some strings"
dat <- read.table(file = 'data.csv', header = TRUE)
Without highlighting it’s harder to detect syntax errors:
numbers <- c("one", "two, "three")

if (x > 0) {
  3 * x + 19
} esle {
  2 * x - 20
}
With highlighting it’s easier to detect syntax errors:
RStudio IDE has features of all good IDEs:
- Syntax highlighting
- Syntax aware
- Able to evaluate R codei
- by line
- by selection
- entire file
- Command completion
Use an IDE with autocompletion
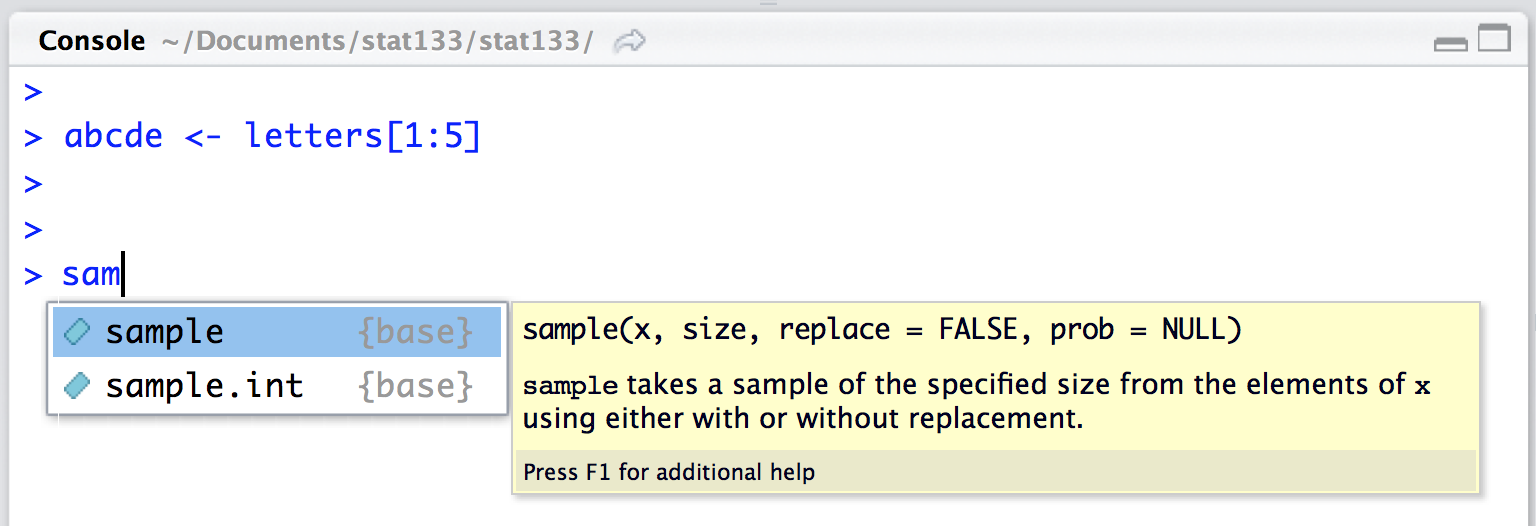
Figure 28.1: IDE with autocompletion
Use an IDE that provides helpful documentation
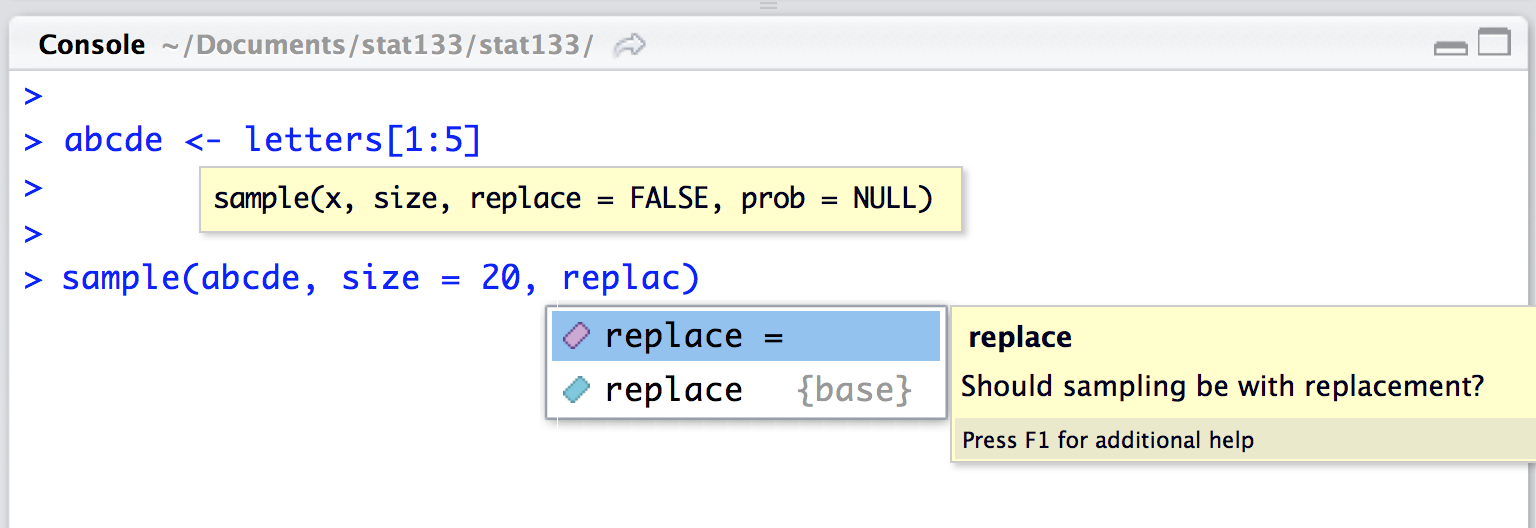
Figure 28.2: IDE with help documentation
28.2 Good Source Code
Think about programs/scripts/code as works of literature (Literate Programming). Well readable by humans, and as much self-explaining as possible
“Let us change our traditional attitude to the construction of programs: Instead of imagining that our main task is to instruct a computer what to do, let us concentrate rather on explaining to human beings what we want a computer to do”. Donald Knuth (Literate Programming, 1984)
Literate programming recommendations:
- Choose the names of variables carefully
- Explain what each variable means
- Strive for a program that is comprehensible
- Introduce concepts in an order that is best for human understanding
Here’s an example of instructing a computer what to do
Can you guess what the above code is doing? It’s better to write code in a way that we explain a human being what we want a computer to do
Better to write a function that is human-understandable, not just machine-understandable
# example
is_positive_integer <- function(x) {
  (is.numeric(x) & x > 0 & x %% 1 == 0)
}

is_positive_integer(2)

is_positive_integer(2.1)
28.2.1 Indentation
- Keep your indentation style consistent
- There is more than one way of indenting code
- There is no “best” style that everyone should be following
- You can indent using spaces or tabs (but don’t mix them)
- Can help in detecting errors in your code because it can expose lack of symmetry
- Do this systematically (RStudio editor helps a lot)
Don’t write code like this:
# Don't do this!
if(!is.vector(x)) {
stop('x must be a vector')
} else {
if(any(is.na(x))){
x <- x[!is.na(x)]
}
total <- length(x)
x_sum <- 0
for (i in seq_along(x)) {
  x_sum <- x_sum + x[i]
}
x_sum / total
}
Instead, write with indentation
# better with indentation
if(!is.vector(x)) {
  stop('x must be a vector')
} else {
  if(any(is.na(x))) {
    x <- x[!is.na(x)]
  }
  total <- length(x)
  x_sum <- 0
  for (i in seq_along(x)) {
    x_sum <- x_sum + x[i]
  }
  x_sum / total
}
There are several Indenting Styles
# style 1
find_roots <- function(a = 1, b = 1, c = 0)
{
  if (b^2 - 4*a*c < 0)
  {
    return("No real roots")
  } else
  {
    return(quadratic(a = a, b = b, c = c))
  }
}

# style 2
find_roots <- function(a = 1, b = 1, c = 0) {
  if (b^2 - 4*a*c < 0) {
    return("No real roots")
  } else {
    return(quadratic(a = a, b = b, c = c))
  }
}
Benefits of code indentation:
- Easier to read
- Easier to understand
- Easier to modify
- Easier to maintain
- Easier to enhance
28.2.2 Reformat Code in RStudio
- RStudio provides code reformatting (use it!)
- Click Code on the menu bar
- Then click Reformat Code
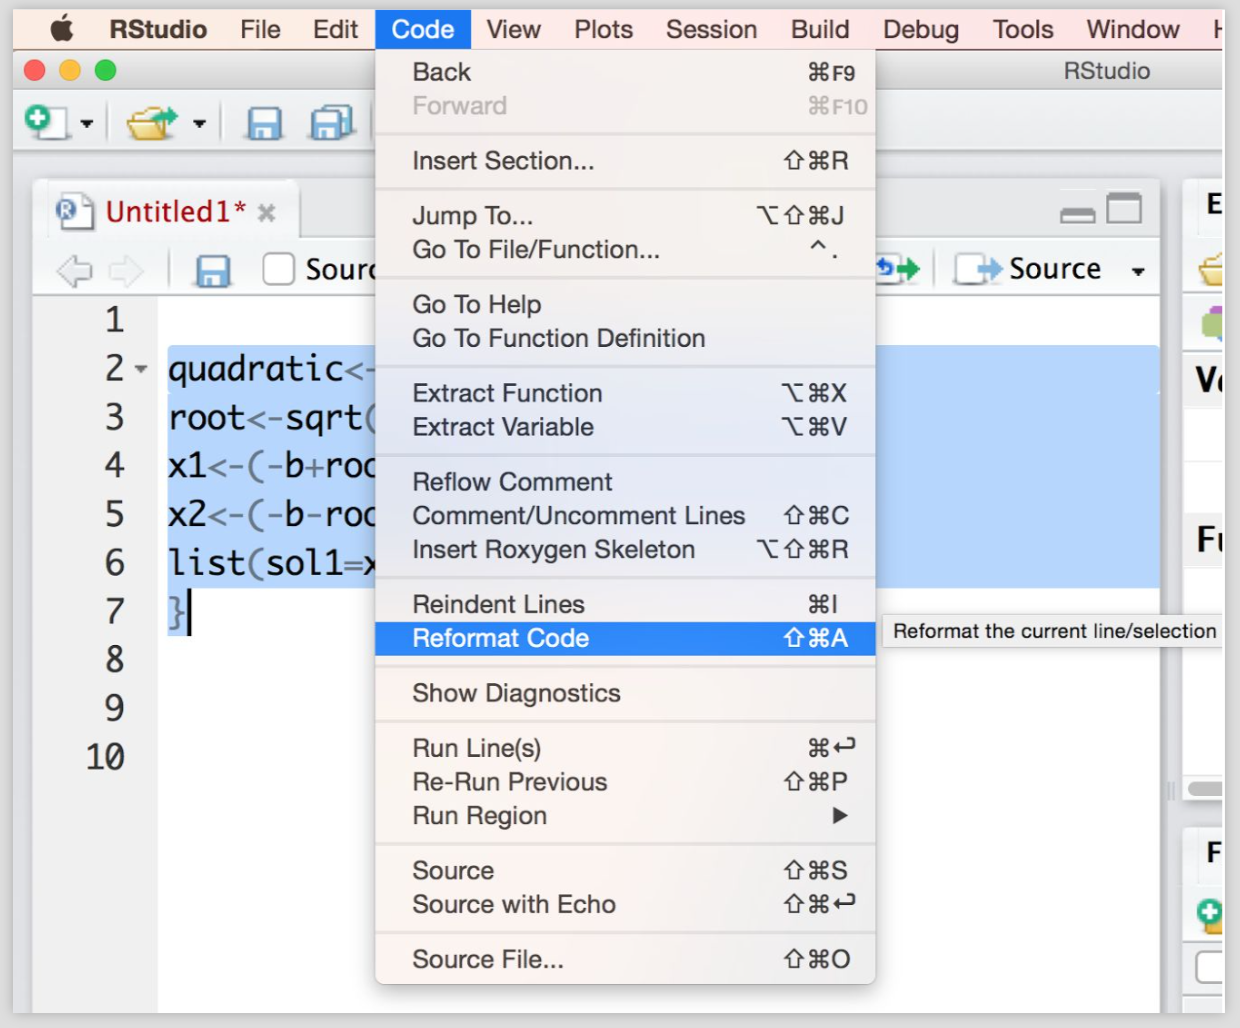
Figure 28.3: Reformat code in RStudio
# unformatted code
quadratic<-function(a=1,b=1,c=0){
root<-sqrt(b^2-4*a*c)
x1<-(-b+root)/2*a
x2<-(-b-root)/2*a
list(sol1=x1,sol2=x2)
}


# reformatted code
quadratic <- function(a = 1, b = 1, c = 0) {
  root <- sqrt(b ^ 2 - 4 * a * c)
  x1 <- (-b + root) / 2 * a
  x2 <- (-b - root) / 2 * a
  list(sol1 = x1,sol2 = x2)
}
28.2.3 Meaningful Names
Choose a consistent naming style for objects and functions
someObject(lowerCamelCase)SomeObject(UpperCamelCase)some_object(underscore separation)some.object(dot separation)
Avoid using names of standard R objects, for example:
vectormeanlistdataccolors
If you’re thinking about using names of R objects, prefer something like this
xvectorxmeanxlistxdataxcxcolors
Better to add meaning like this
mean_salaryinput_vectordata_listdata_tablefirst_lastsome_colors
Here’s a quiz example, what does the following functino getThem() do?
getThem <- function(values, y) {
  list1 <- c()

  for (i in values) {
    if (values[i] == y)
      list1 <- c(list1, x)
  }
  return(list1)
}
this is more meaningful:
getFlaggedCells <- function(gameBoard, flagged) {
  flaggedCells <- c()

  for (cell in gameBoard) {
    if (gameBoard[cell] == flagged)
      flaggedCells <- c(flaggedCells, x)
  }
  return(flaggedCells)
}
Also, better to use meaningful distinctions
# argument names 'a1' and 'a2'?
move_strings <- function(a1, a2) {
  for (i in seq_along(a1)) {
    a1[i] <- toupper(substr(a1, 1, 3))
  }
  a2
}


# argument names
move_strings <- function(origin, destination) {
  for (i in seq_along(origin)) {
    destination[i] <- toupper(substr(origin, 1, 3))
  }
  destination
}
Prefer Pronounceable Names
28.2.4 White Spaces
- Use a lot of it
- around operators (assignment and arithmetic)
- between function arguments and list elements
- between matrix/array indices, in particular for missing indices
- Split long lines at meaningful places
Avoid this
Much Better
Another example:
# Avoid this
plot(x,y,col=rgb(0.5,0.7,0.4),pch='+',cex=5)

# okay
plot(x, y, col = rgb(0.5, 0.7, 0.4), pch = '+', cex = 5)
Another readability recommendation is to limit the width of line: they should be broken/wrapped around so that they are less than 80 columns wide
# lines too long
histogram <- function(data){
hist(data, col = 'gray90', xlab = 'x', ylab = 'Frequency', main = 'Histogram of x')
abline(v = c(min(data), max(data), median(data), mean(data)),
col = c('gray30', 'gray30', 'orange', 'tomato'), lty = c(2,2,1,1), lwd = 3)
}
Lines should be broken/wrapped aroung so that they are less than 80 columns wide
28.2.5 White spaces
- Spacing forms the second important part in code indentation and formatting.
- Spacing makes the code more readable
- Follow proper spacing through out your coding
- Use spacing consistently
# this can be improved
stats <- c(min(x), max(x), max(x)-min(x),
  quantile(x, probs=0.25), quantile(x, probs=0.75), IQR(x),
  median(x), mean(x), sd(x)
)
Don’t be afraid of splitting one long line into individual pieces:
# much better
stats <- c(
  min(x),
  max(x),
  max(x) - min(x),
  quantile(x, probs = 0.25),
  quantile(x, probs = 0.75),
  IQR(x),
  median(x),
  mean(x),
  sd(x)
)
You can even do this:
# also OK
stats <- c(
  min    = min(x),
  max    = max(x),
  range  = max(x) - min(x),
  q1     = quantile(x, probs = 0.25),
  q3     = quantile(x, probs = 0.75),
  iqr    = IQR(x),
  median = median(x),
  mean   = mean(x),
  stdev  = sd(x)
)- All commas and semicolons must be followed by single whitespace
- All binary operators should maintain a space on either side of the operator
- Left parenthesis should start immediately after a function name
- All keywords like
if,while,for,repeatshould be followed by a single space.
All binary operators should maintain a space on either side of the operator
All binary operators should maintain a space on either side of the operator
# Not really recommended
z <- 6*x + 9*y

# Recommended (option 1)
z <- 6 * x + 9 * y

# Recommended (option 2)
z <- (7 * x) + (9 * y)
Left parenthesis should start immediately after a function name
# NOT Recommended
read.table ('data.csv', header = TRUE, row.names = 1)

# Recommended
read.table('data.csv', header = TRUE, row.names = 1)
All keywords like if, while, for, repeat should be followed by a single
space.
28.2.6 Syntax: Parentheses
Use parentheses for clarity even if not needed for order of operations.
another example
28.2.8 Source Code Files
- Break code into separate files (<2000-3000 lines per file)
- Give files meaningful names
- Group related functions within a file
Include Header information such as
- Who wrote / programmed it
- When was it done
- What is it all about
- How the code might fit within a larger program
Header example:
# ===================================================
# Some Title
# Author(s): First Last
# Date: month-day-year
# Description: what this code is about
# Data: perhaps is designed for a specific data set
# ===================================================
If you need to load R packages, do so at the beginning of your script, after the header:
# ===================================================
# Some Title
# Author(s): First Last
# Date: month-day-year
# Description: what this code is about
# Data: perhaps is designed for a specific data set
# ===================================================

library(stringr)
library(ggplot2)
library(MASS)
28.3 Don’t Repeat Yourself
The famour DRY principle
Every piece of knowledge must have a single, unambiguous, authoritative representation within a system.
Many people write code like this:
# avoid repetition
plot(x, y, type = 'n')
points(x[size == 'xsmall'], y[size == 'xsmall'], col = 'purple')
points(x[size == 'small'], y[size == 'small'], col = 'blue')
points(x[size == 'medium'], y[size == 'medium'], col = 'green')
points(x[size == 'large'], y[size == 'large'], col = 'orange')
points(x[size == 'xlarge'], y[size == 'xlarge'], col = 'red')
There’s a lot of repetition in the previous code chunk; this can be solved
with the use of a for() loop:
# avoid repetition
size_colors <- c('purple', 'blue', 'green', 'orange', 'red')
plot(x, y, type = 'n')
for (i in seq_along(levels(size))) {
  points(x[size == i], y[size == i], col = size_colors[i])
}
28.3.1 Look at other people’s code
Look at other people’s code
- https://github.com/hadley
- https://github.com/yihui
- https://github.com/karthik
- https://github.com/kbroman
- https://github.com/cboettig
- https://github.com/garrettgman
Your Own Style
- It takes time to develop a personal style
- Try different styles and see which one best fits you
- Sometimes you have to adapt to a company’s style
- There is no one single best style
28.3.2 Exercises
What’s wrong with this function?
average <- function(x) {
  l <- length(x)
  for(i in l) {
    y[i] <- x[i]/l
    z <- sum(y[1:l])
    return(as.numeric(z))
  }
}
What’s wrong with this function?
freq_table <- function(x) {
  table <- table(x)
  'category' <- levels(x)
  'count' <- print(table)
  'prop' <- table/length(x)
  'cumcount' <- print(table)
  'cumprop' <- table/length(x)
  if(is.factor(x)) {
    return(data.frame(rownames=c('category', 'count','prop',
                                 'cumcount','cumprop')))
  } else {
    stop('Not a factor')
  }
}- What other suggestions do you have?
- How could we restructure the code, to make it easier to read?
- Grab a buddy and practice “code review”. We do it for methods and papers, why not code?
- Our code is a major scientific product and the result of a lot of hard work!
28.2.7 Comments
Comment your code
Line spaces and Comments
with line spaces and comments
Different line styles:
for example:
or this one
Include comments to say what a block does, or what a block is intended for
Another example
Be careful with your comments (you never know who will end up looking at your code, or where you’ll be in the future)