29 Shiny Apps
So far, we’ve been creating graphics with functions from "ggplot2". There are
many graphics packages in R, but most of them only produce static charts.
One interesting package for creating interactive graphics is "shiny", that
allows us to create so-called shiny apps. These are essentially HTML documents
(i.e. webpages) that can render, among other things, interactive plots.
In this chapter, you will get your first contact with shiny apps, working on a toy example that RStudio produces by default. We will focus on the fundamental aspects of Shiny so that after reading this chapter, you can create a simple app.
We should say that shiny apps are data-based products more suitted for the communication and reporting phase of a data analysis cycle (DAC). But they open the door for developing interesting visualizations, that well designed, can make exploratory analysis, or any analysis in general, more fun, interactive, elightening, and delightful.
29.1 Histogram Example
To create the default shiny app provided in RStudio, go to the menu bar, choose the File tab, then New File, and click on Shiny Web App…
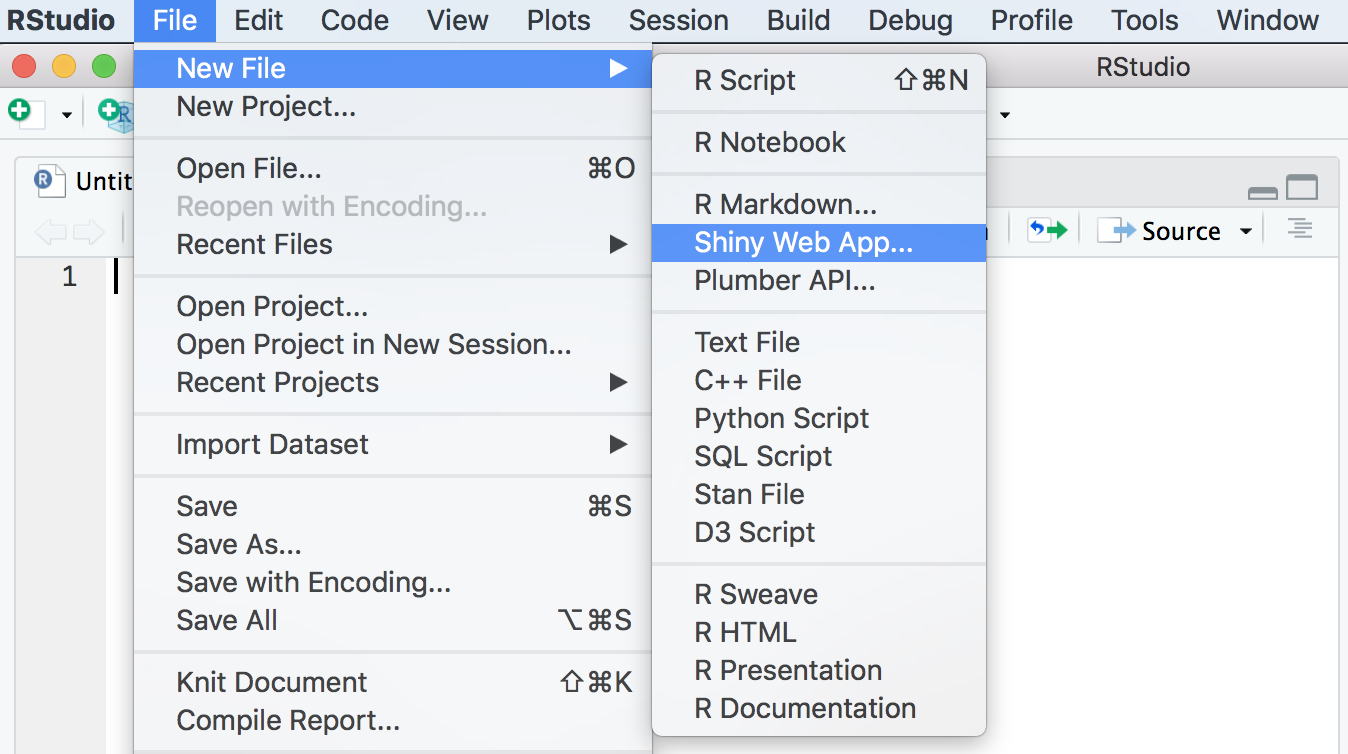
Figure 29.1: Creating a new shiny app
A window will pop-up for you to give a name to your app, and specify a
directory where it will be saved. There is also an option to decide whether
the code of the app is to be handled in a single file called app.R (this is
the default option) or in two separate files (ui.R/server.R).
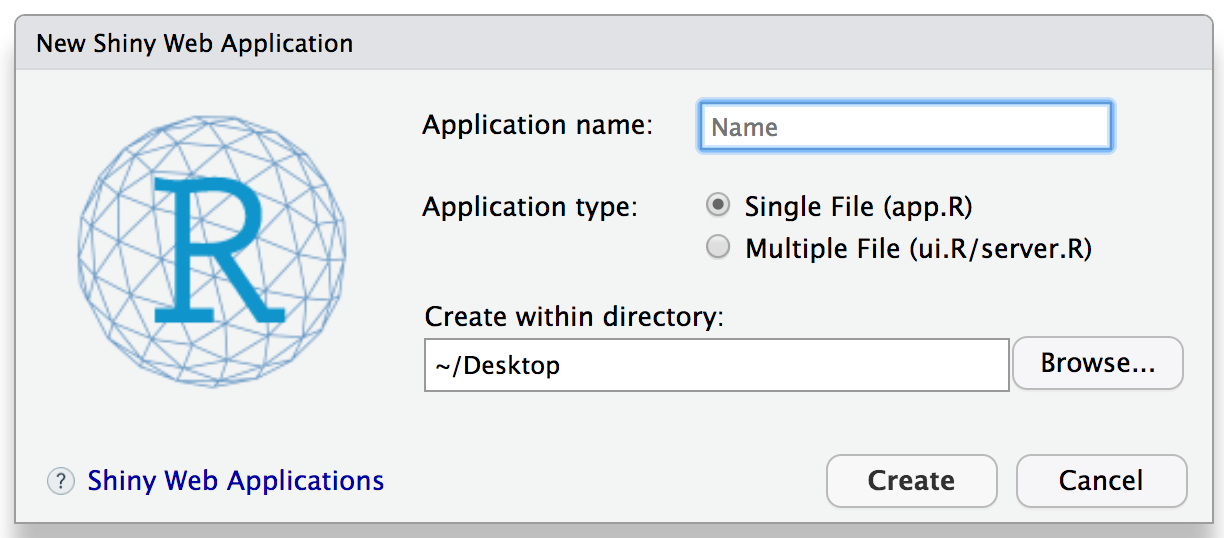
Figure 29.2: Default options when creating a new shiny app
After clicking the Create button, RStudio will do its magic, making a new
folder with the provided name and specified location. This folder will contain
an R script file named app.R with preexisting content for the default shiny
app (see screenshot below).
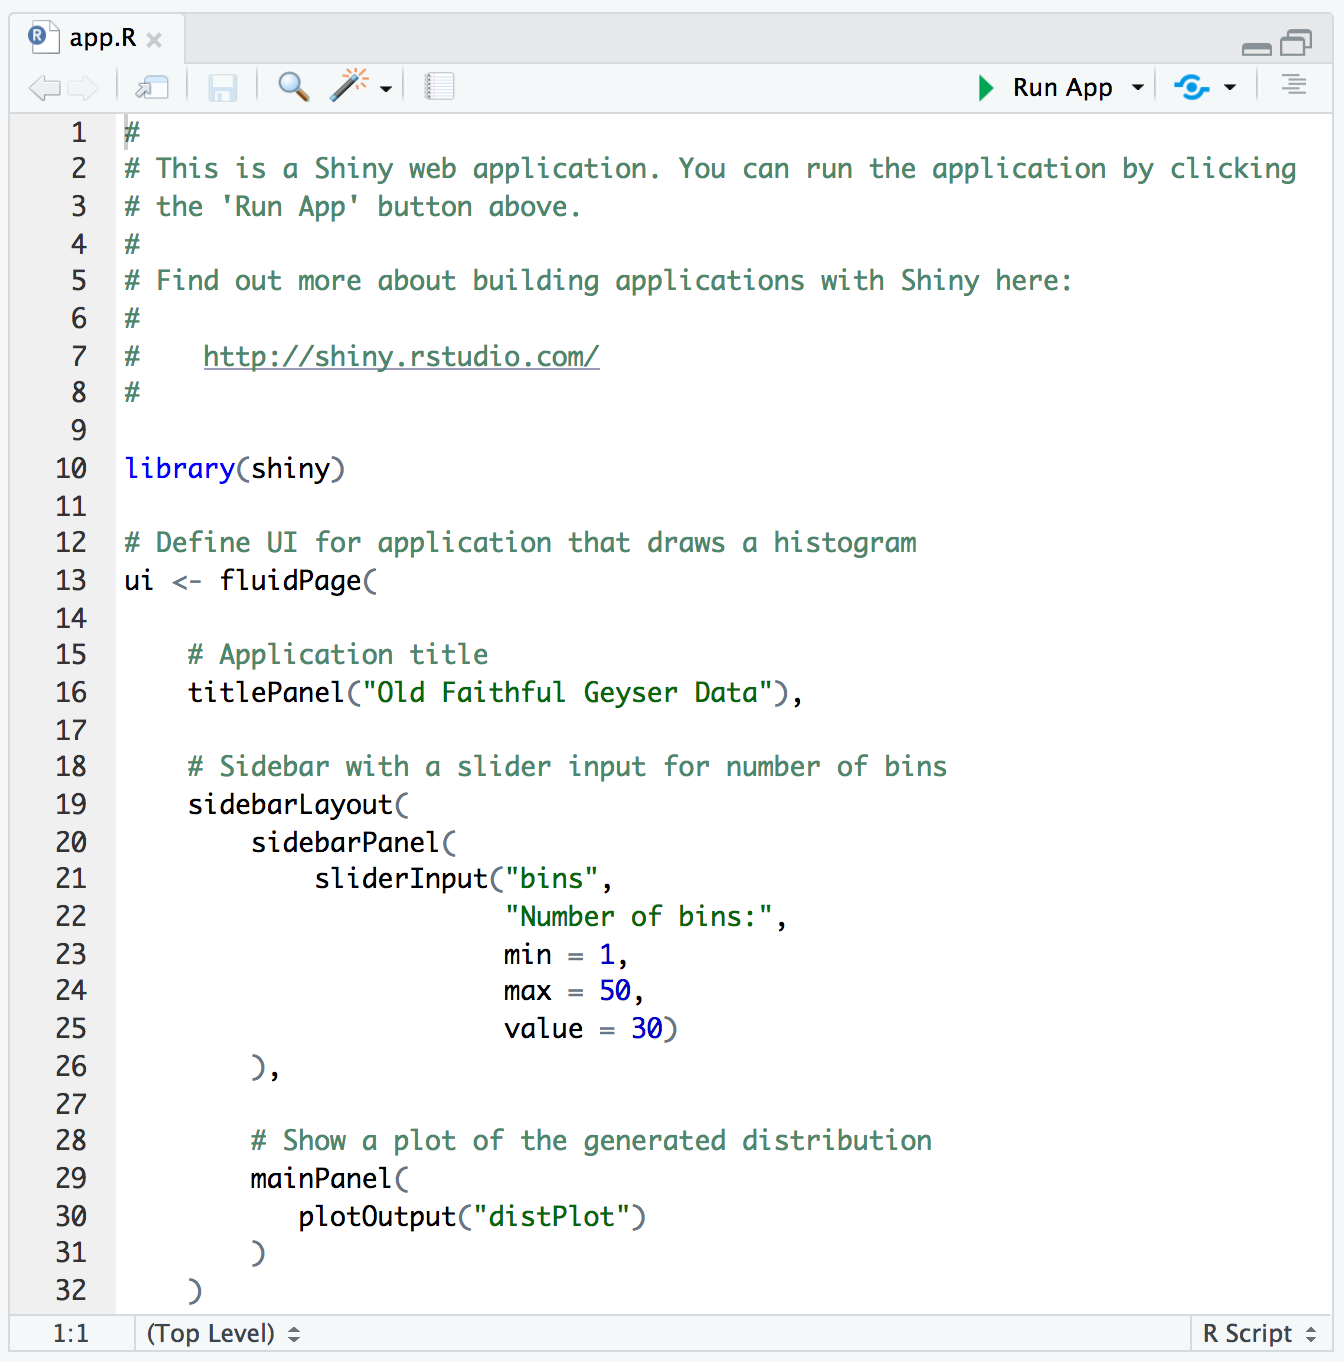
Figure 29.3: R script file for the default shiny app
This default app uses the built-in data oldfaithful, which is a data frame
of eruption data from the famous
Old Faithful
geyser in Yellowstone national park. Clicking on the Run App button located
at the top of the tab (where the R script is), RStudio will open a window to
render an HTML webpage for the app, like the following screenshot:
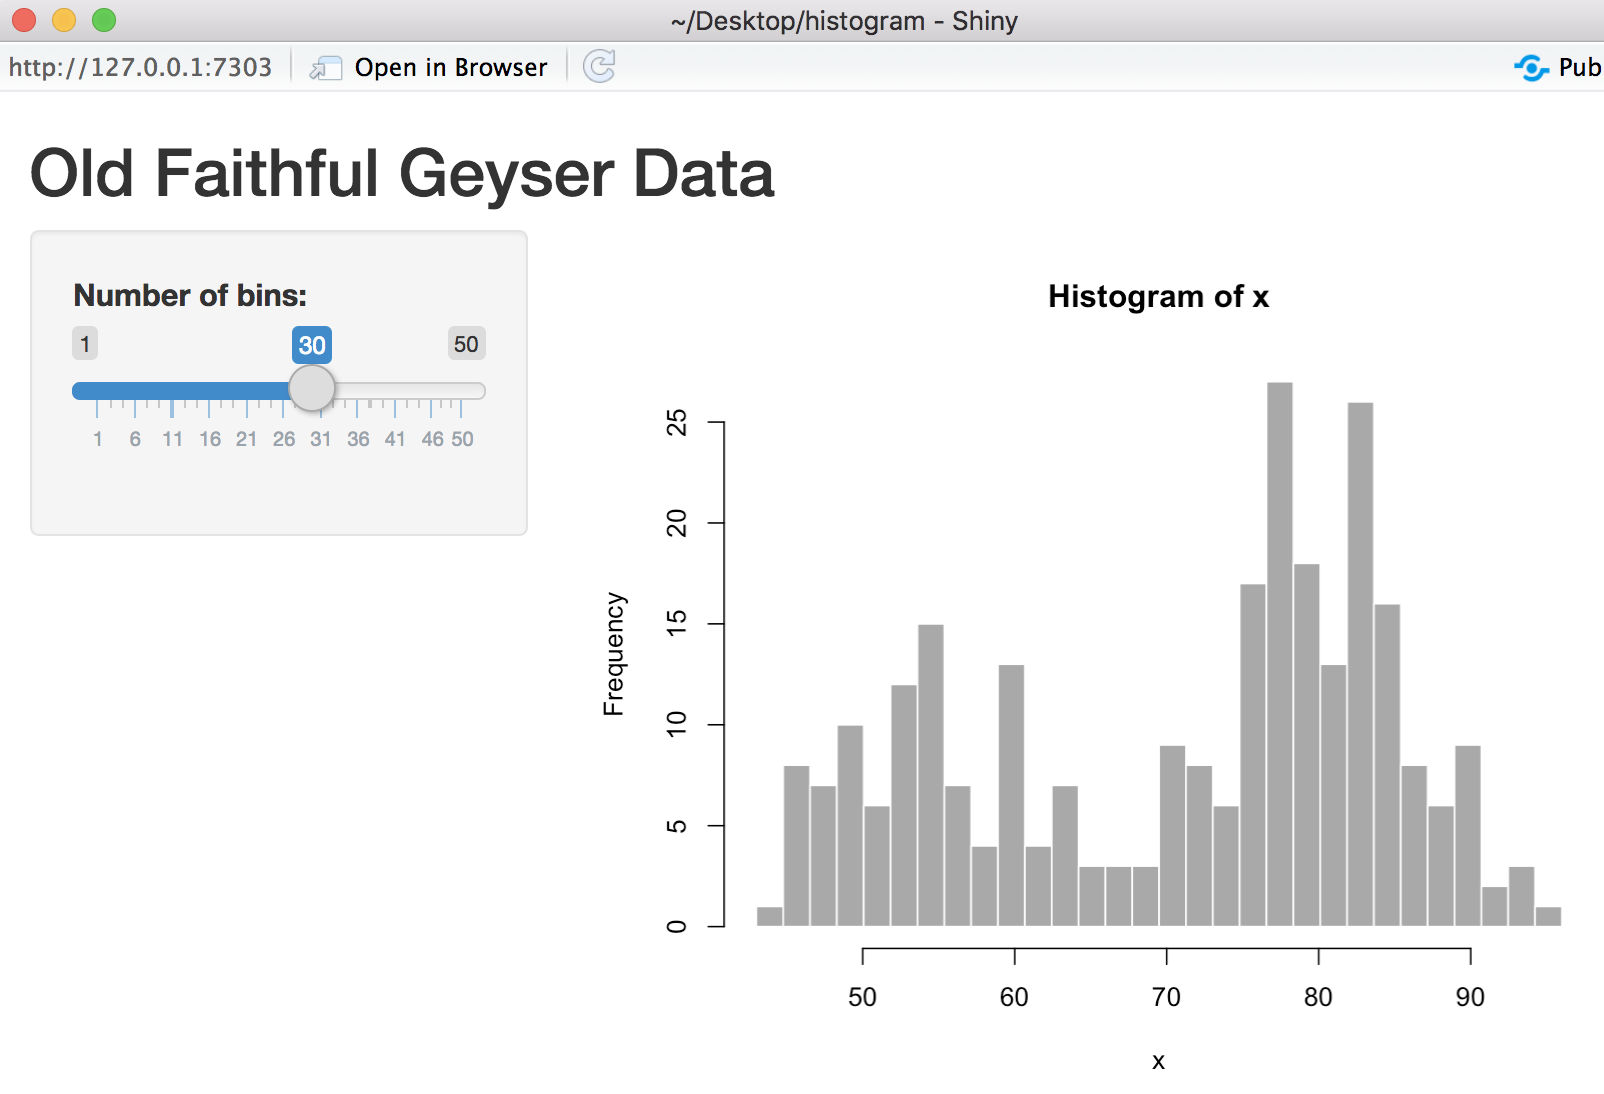
Figure 29.4: HTML webpage rendering an interactive histogram
29.2 What’s going on?
Let’s talk about How does a shiny app work from the high-level intuition point of view.
- There’s an R script
- There’s an HTML document
29.2.1 Anatomy of R script
All you have to work with is the R script file app.R. This file has a
specific structure:
library(shiny)uiuser interfaceserverhas the code (to do computations)shinyApp()to run the app
29.2.2 HTML webpage with histogram
The output is a webpage (i.e. HTML document). It has two main areas: one area for the sidebar, and the other area for the plot. These are technically called panels (the sidebar panel, and the main panel).
The HTML webpage has:
- title: Old Faithful Geyser Data
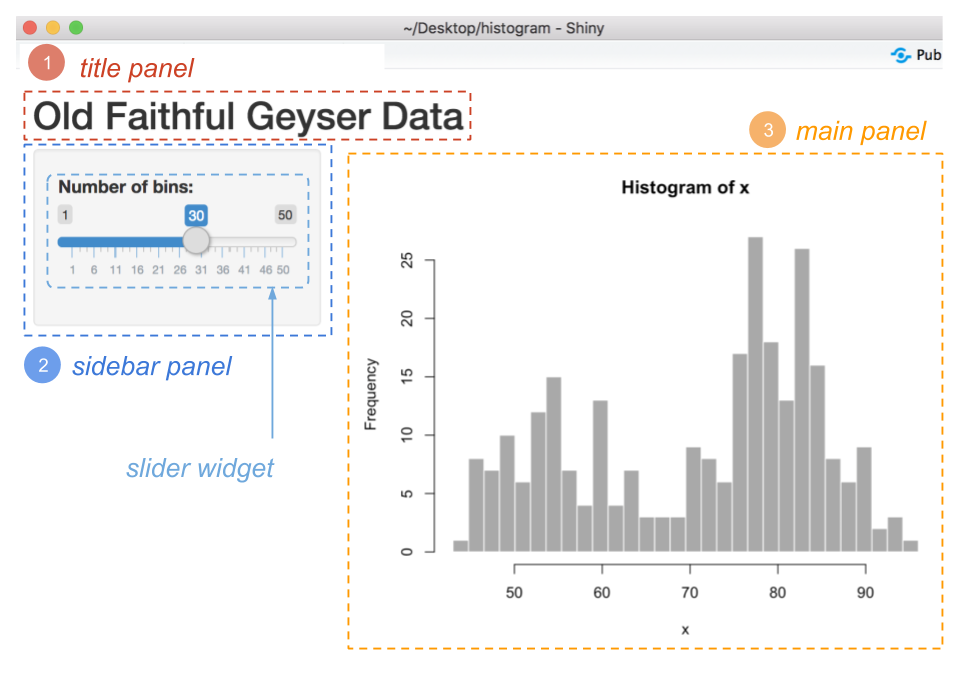
Figure 29.5: User Interface elements in shiny app
29.2.3 Resources
The main source is Rstudio shiny website
- Video tutorial “Part 1 - How to build a Shiny app”
- Gallery
Gallery of Widgets
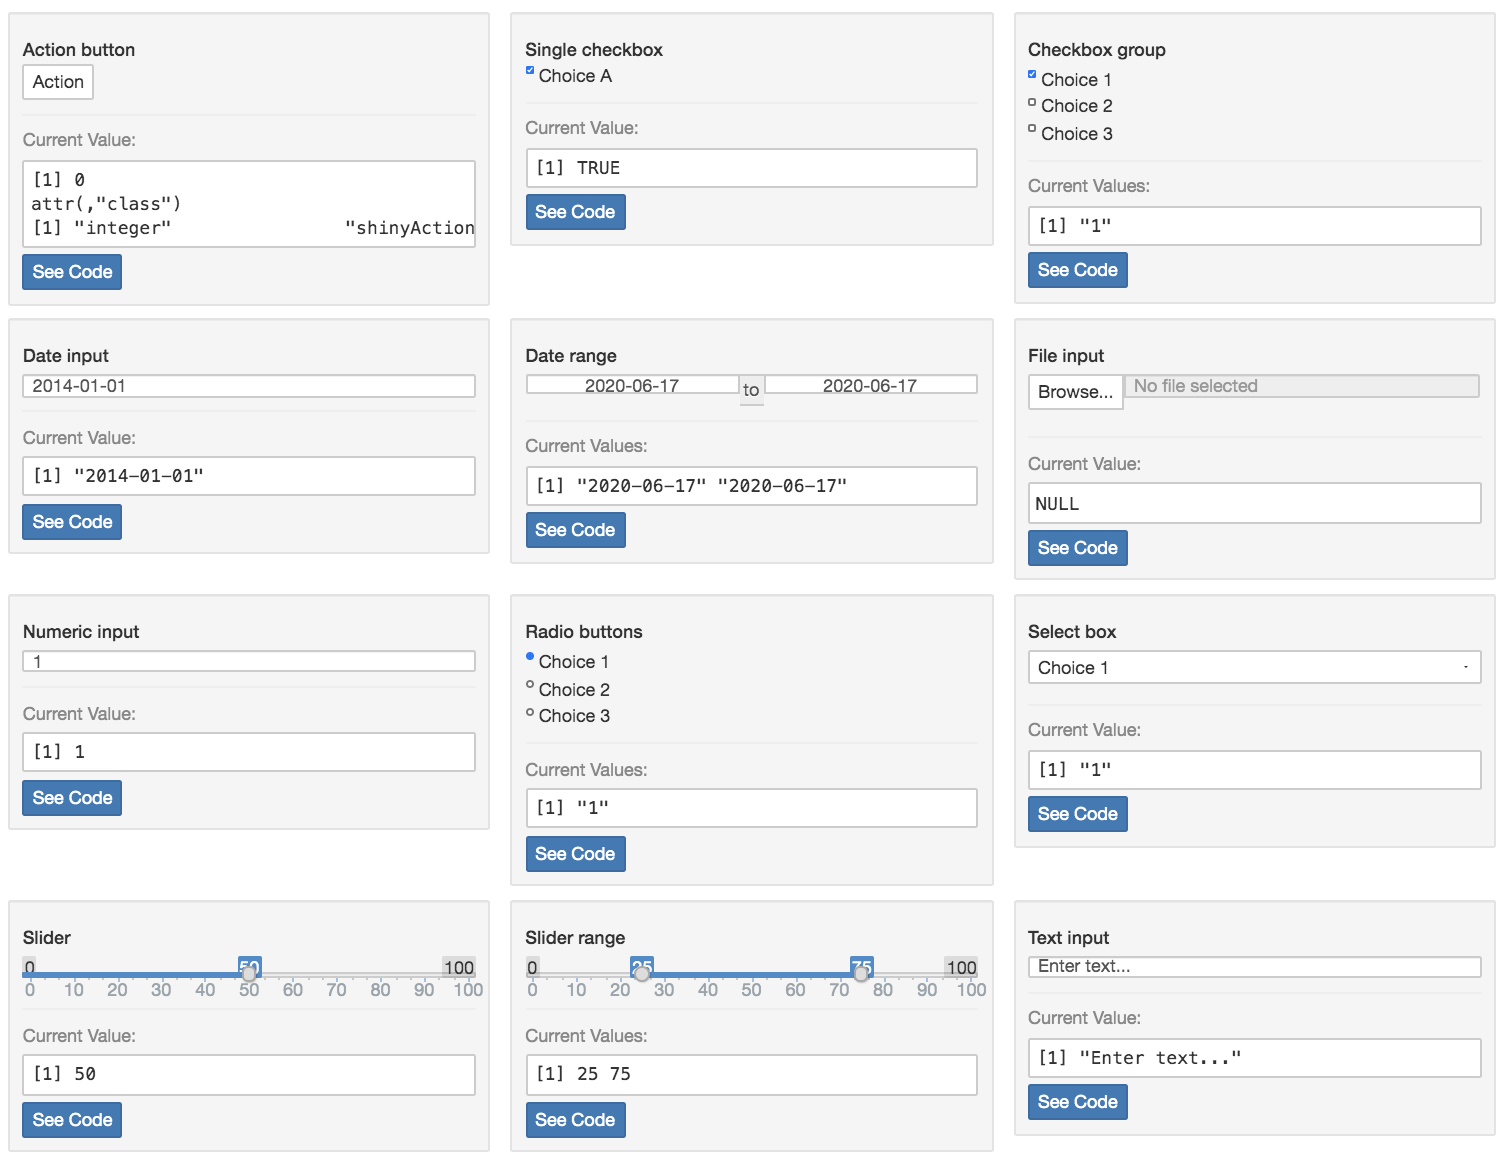
Figure 29.6: Gallery of shiny widgets