2 The Data Analysis Cycle
Data analyses can be performed in so many different forms depending on the types of data, the goals and purposes of the analysis, the applied methodologies, the available resources (e.g. human, technical, computational, financial, time), the audience, and the scope, just to mention a few aspects influencing a Data Analysis Project or DAP.
While it is true that you can carry out a DAP in various ways, at different levels of complexity, and with one or more goals in mind, you will usually find that a standard analysis will have the following elements:
- data collection (acquisition)
- data cleaning
- data tidying
- exploratory data analysis
- confirmatory data analysis
- data visualization
- model building
- simulations
- communication
2.1 Understanding the Data Analysis Process
Cartoonist and roboticist Jorge Cham captures the essential stages of a typical data analysis in the following comic strip
https://phdcomics.com/comics/archive_print.php?comicid=462
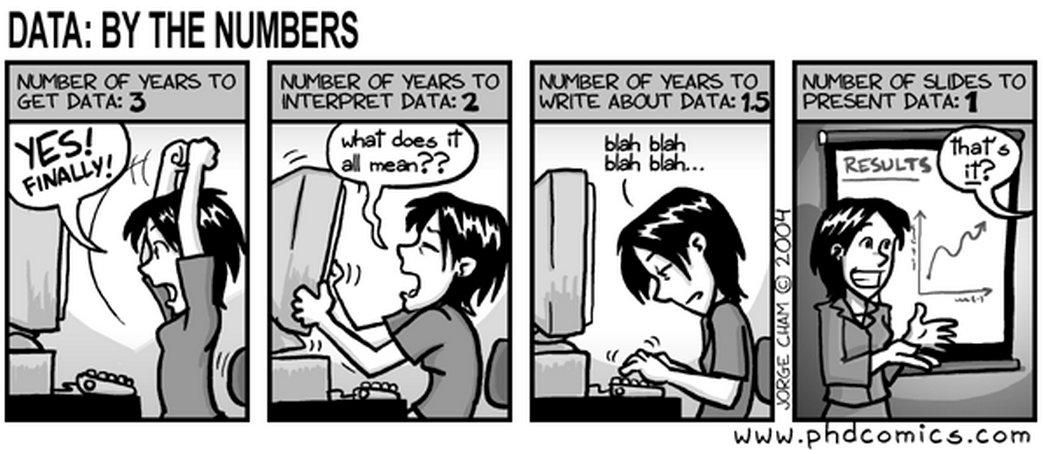
Figure 2.1: Data By the Numbers (by Jorge Cham)
Jorge’s illustration is one of our favorite cartoons. If you can, print a copy and keep it in your desk (or fridge, or your office door) as a reminder of the stages every data analysis project goes through. The cartoon contains four frames, each one illustrating the main stages of what traditionally happens in research projects, heavily based on data analysis, within academia (e.g. PhD project). But it can also be generalized to most real life contexts.
Each frame in the cartoon is associated with a set of general tasks:
| Preparation | Analysis | Report | Communication |
|---|---|---|---|
| Acquisition | Exploration | Document(s) | Talk |
| Storage | Description | Article(s) | Seminar |
| Cleaning | Visualization | Slides | Lecture |
| Processing | Hypothesis Testing | Blog post(s) | Conference |
| Tidying | Simulations | Dissertation | Interview |
| Reshaping | Model fitting | Book(s) | Other |
At a more conceptual level, and losing Cham’s comic enchanment, we have created our own diagram of the Data Analysis Cycle (DAC), depicting what we consider to be the three main stages of such cycle:

Figure 2.2: Conceptual diagram of the Data Analysis Cycle
In our DAC diagram, we have merged the Report and the Communication frames into a single entity because these two tasks always go together.
Each circle is associated with a set of general tasks. Not all projects will have all these tasks. But in this way you can have a conceptual picture in which to fit almost any DAP:

Figure 2.3: Common tasks in the data analysis cycle
The Data Preparation frame has to do with tasks that involve acquiring data, storage, cleaning, processing, reshaping, and tidying. The Core Analyses frame usually implies exploratory data analysis, descriptive summaries, data visualization, maybe testing hypothesis, running simulations, and building models. The Report and Communication frame, in turn, has to do with writing an assortment of documents, articles, slides, blog post, some times a books, a dissertation, or a generic manuscript. Finally, the Communication frame is the part of the project where you share the insights of your analysis with a certain audience. This usually takes the form of a talk, a seminar, a guest lecture, being interviewed, or other kind of communication action. The table below groups the typical tasks of each component.
2.1.1 Data Analysis is a lot like Cooking
We also like to compare a data analysis project and its cycle with cooking. Using the cooking metaphor, data preparation is like when you go to the grocery store or the farmers market to buy all the food and ingredients for your meals. This part also involves washing, pealing, letting dry, slicing, dicing, cutting, and performing all those small steps that are fundamental for a good result. Part of this data preparation also involves the “mise-en-place”; everything in its place: the set up required before cooking, involving organizing and arranging the ingredients and the utensils.
Then comes the actual cooking. This is perhaps the most “glamorous part” of any
cooking activity. You get to use the various utensils like the mixer, the
stove, different pans, the oven; you also get to roast, fry, sauté, boil
simmer, etc.
Once the food is ready, you need to prepare the dishes, set the table, decorate the plates, make sure the serving temperature is appropriate, and so on.
2.2 Comments on Data Analysis Cycle
Many people think data analysis is a linear straightforward process. You open your favorite statistical/data-analysis software, you import the data, run a model, and bang! you get beautiful results and all the answers to your questions. This is too idyllic.
This picture of an ideal data analysis is caused by what happens in most courses, and from what you see in most textbooks. The data is already there, clean, tidy, ready to be imported in R, so that you just have to type a couple of commands to perform a hypothesis test, plot a graph, fit a model, and compute summary statistics and tables. Such a smooth path rarely happens in real life data projects.
Keep in mind that a data analysis cycle is NOT a linear process.
Figure 2.4: Data Analysis is not a linear process
2.2.1 Data Preparation
First: data is never, never, never in the right shape. You’re one of the luckiest persons on earth if all your data is in the right format. But, based on my experience, chances are that you are just like the rest of us mortals. Reshaping and cleaning your data tends to be the most time consuming part of any data analysis project. However, this is probably the part that receives less atention, and almost no one talks about. You don’t see papers in which authors talk about how hard, difficult and frustrating was the data preprocessing part. I am still waiting to read a paper in which the authors talk about how much time, and how much they struggled to put the data in the right shape.
2.2.2 Actual Analysis
Most of the curricula for courses about data analysis, statistics, quantitative research, and similar fields, has been designed for the second frame of the cartoon: the part of a project that involves “crunching numbers”. Most of the education is focused on the modeling part, on the methods and techniques. Very little space is dedicated to talk about how to work with data.
Figure 2.5: What we always teach
As a student, most of your assignments focus on the methodological parts. Think about what usually happens in your courses: the professor gives you a clean data set in the standard form of a table which contains the variables that you use to apply a specific technique. All you just have to worry about is finding the right results: computing summary statistics, or performing the adequate hypothesis test to report the obtained p-values. You probably need to produce a chart that meets some specifications. But you don’t have to worry about cleaning, processing, and reshaping the data. You may need to write some description and perhaps some sort of report. But not all professors and programs have enough human resources and/or time to sit down and read the papers.
2.2.3 Report and Communication
Likewise, we don’t really teach writing skills: how to prepare a report, the parts of an article, the images, the tables. All of this requires learning principles of good writing, styleguides, design, and of course a lot of practice.
In the real world, working on the analysis part, whether it is exploration, description, confirmation, simulations, model building, or data visualization, is only but a fraction of a DAP. It is an important part, no doubt about it, but it is just a part. You will tend to spend more time getting the data in the right shape, reviewing your code, getting rid of ever present bugs, writing the report(s), and polishing the documentation.
Writing code will take you some time. But you will definitely spend more time reviewing the code, looking for bugs, documenting the functions and testing them, and making sure everything works correctly.
Figure 2.6: What we rarely teach
Just like there is not a unique way to cook, you can say the same thing about a data analysis project: there is no one way to do a Data Analysis Project (DAP). In the same sense that there are multiple ways to perform a data science endevour, there are also many ways in which data analysis should not be done.