1.1 Data: Individuals and Variables
To illustrate some of the ideas presented in this chapter I’m going to use a toy example with data of three individuals from a galaxy far, far away: Leia Organa, Luke Skywalker, and Han Solo.

Figure 1.1: Three individuals
In particular, let’s consider the following information about these subjects:
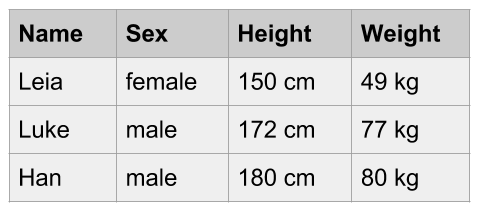
- Leia is a woman, 150 centimeters tall, and weighs 49 kilograms.
- Luke is a man, 172 centimeters tall, and weighs 77 kilograms.
- Han is a man, 180 centimeters tall, and weighs 80 kilograms.
We can say that the above information lists characteristics of three individuals. Or put in an equivalent way, that three subjects are described based on some of their characteristics: Name, Sex, Height, and Weight. Using statistical terminology, we formally say that we have data consisting of three individuals described by some variables.
Statistical terminology is abundant and you’ll find that individuals are also known as observations, cases, objects, samples or items. Example of individuals can be people, animals, plants, planets, spaceships, countries, or any other kind of object.
A variable is any characteristic of an individual. Sometimes we refer to variables as features, aspects, indicators, descriptors, or properties that we measure or observe on individuals.
This combo of individuals and variables is perhaps the most common conceptualization of the term “data” within Statistical Learning methods. But it’s not the only one. Bear in mind that there are other ways in which analysts and researchers think about data.
1.1.1 Representing Data
Assuming that our data consists of Name, Sex, Height and Weight for three individuals, we can present this information in various forms. One option is to organize the information in some sort of rectangular or tabular layout, like the one below:

Figure 1.2: Conceptual table
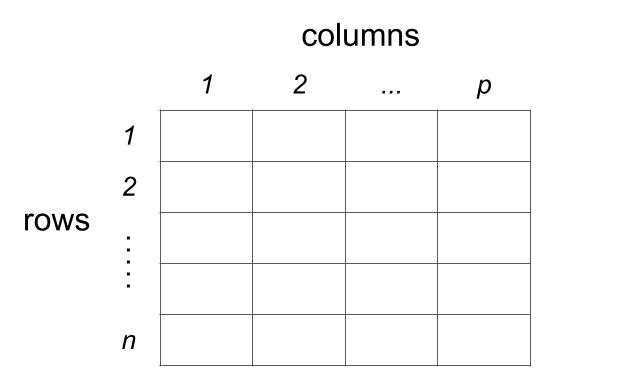
We can say that this data set is in tabular form, with four columns and three rows (four if you include the row of column names).
The same data could be represented in a non-tabular form. An example of a non-tabular format is XML (eXtensible Markup Language). In this case, we can organize the information in a hierarchical way with embeded elements also known as nodes, like in the following example:
<character>
  <name>Leia</name>
  <sex>female</sex>
  <weight>150 cm</weight>
  <height>49 kg</height>
</character>
<character>
  <name>Luke</name>
  <sex>male</sex>
  <weight>172 cm</weight>
  <height>77 kg</height>
</character>
<character>
  <name>Han</name>
  <sex>male</sex>
  <weight>180 cm</weight>
  <height>80 kg</height>
</character>
In the above example there are three <character> nodes, each one containing four nodes: <name>, <sex>, <weight>, and <height>. This is an example of what I call raw data. Don’t worry if you are not familiar with XML. I just want to give you an example of the various ways in which data can be organized.
From a computational point of view, you could actually find a plethora of formats and conventions used to store information, and data sets in particular. Some formats have been designed to store data in a way that mimics the structure of a rectangular table. But you can find other formats that use a non-tabular structure, like XML.
When data is stored in a format that is supposed to represent a table, it is common to find visual displays with some grid of rows and columns.

Figure 1.3: Data in tabular format
This is another example of raw data, in particular a raw data table. The data is visually organized and displayed in a rectangular grid of cells. However, this table is not ready yet to be manipulated statistically, much less algebraically. Obviously, this table needs some processing and reshaping in order to obtain a table with numerical information that becomes useful for matrix algebra operations.
More often than not, raw data will be far from being in tabular format, or at least it will require extra reshaping steps so that it can be ready for the analysis. Although this is a very common issue in practice, in this book I will assume that you’ve already struggled to get the data in the right rectangular shape.
1.1.2 Tabular Data
Eventually, to be analyzed with statistical learning tools and other multivariate techniques, your data will typically be required to have a certain specific structure, usually in the form of some sort of table or spreadsheet format (e.g. rows and columns).

Figure 1.4: Data Table Format
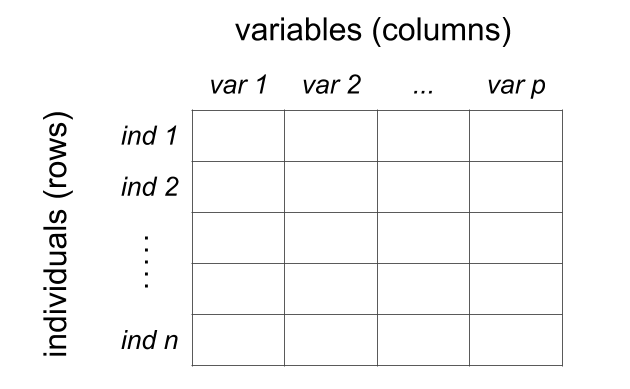
Depending on the nature of the data, and the way it is organized, rows and columns will have a particular meaning. The most common data table setting is the one of individuals-and-variables. Although somewhat arbitrary, the standard convention is that we use the columns to represent variables, and the rows to represent individuals.

Figure 1.5: Conceptual table of individuals and variables