7.2 Mean as a Balancing Point
What does the mean do? In what sense the mean is a “typical” value? How do you make sense of a mean value?
To understand what the mean is doing, I find it helpful to visualize the values of a variable as points in a number-line, or with a dot-plot. Consider a variable having five numbers: \(X = (1, 2, 6, 7, 9)\), that can be visualized on a number line (see image below). Imagine that the number line is like a weighting scale or a teeter-totter (or see-saw).
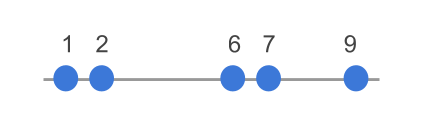
Figure 7.1: Values on a number-line
The mean plays the role of the balancing point. In other words, \(\bar{x}\) is the value that balances out the scale and keeps things on equilibrium.
In this example, the value of 5 is the balancing point:
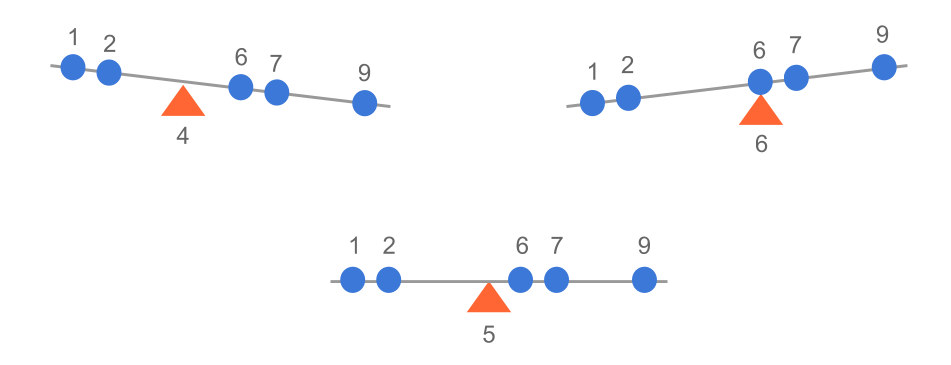
Figure 7.2: Mean as a balancing point
Saying that 5 is the balancing point has a specific meaning. It means that the signed distances of all the values with respect to the mean cancel out. If you calculate the deviations from the mean: \((x_i - \bar{x})\), and add them all up, the sum is zero:
\[ (1 - 5) + (2 - 5) + (6 - 5) + (7 - 5) + (9 - 5) = 0 \]
This is a very special property of the mean, indicating that this value is optimal in the sense that it is the only number for which the sum of deviations with itself is zero. In a more algebraic way, say you are looking for a number \(a\) that makes the sum of deviations zero:
\[ \sum_{i=1}^{n} (x_i - a) = 0 \]
What would \(a\) be? Then mean \(\bar{x}\)! No other value would be able to cancel out the sum of deviations around itself.
Keep in mind that the mean is just a summary. In fact, it is just one possible kind of “typical” value (other common measures of center are the median or the mode). As any summary statistic, it involves compressing the information of a variable into a single representative number. But remember: this number does not tell you the whole story about the variability in a variable.